News And Technical Analysis From Instaforex - Business (8) - Nairaland
Nairaland Forum / Nairaland / General / Business / News And Technical Analysis From Instaforex (45807 Views)
Get Startup Bonus Of $500 To Trade From Instaforex / News And Technical Analysis From Superforex / News From Instaforex (2) (3) (4)
(1) (2) (3) ... (5) (6) (7) (8) (9) (10) (11) ... (23) (Reply) (Go Down)
| Re: News And Technical Analysis From Instaforex by Instaforexbuk(f): 3:42pm On Jun 06, 2017 |
Fundamental Analysis of USDJPY for June 6, 2017 After rejecting off the resistance of 111.60 recently, USD/JPY is currently in a bearish run towards 108.50 support level. After a corrective structure yesterday, JPY has gained fresh momentum today amid the positive report on Average Cash Earnings at 0.5% which was expected to be at 0.3% and which previously was at 0.0%. The economic event had a major impact on the currency as growth in the disposable income will trigger bigger consumer spending, thus the economic recovery. On the other hand, today the US will present JOLTS Job Opening report which is expected to show a worse figure of 5.65M which previously was at 5.74M. Besides, IBD/TIPP Economic Optimism is expected to edge up to 51.6 from the previous value of 51.3. As the US economic reports to be published today are not crucial for increasing the volatility in this pair, a further decline of the pair is expected in the coming days. JPY is currently stronger fundamentally than USD as yesterday USD was affected by a series of negative economic reports like ISM Manufacturing Index at 56.9 which was expected to be at 57.1. So, there are higher chances of JPY to gain ground against USD in the coming days. Now let us look at the technical chart. The price has currently showed a good amount of bearish impulsive pressure after Japan's Average Cash Earnings report published today. Currently, there are no support level or barriers to stop the price from hitting the 108.50 support level in the coming days. Price is expected to reach 108.50 recently as the bearish bias continues below the resistance area of 111.60- 112.20. 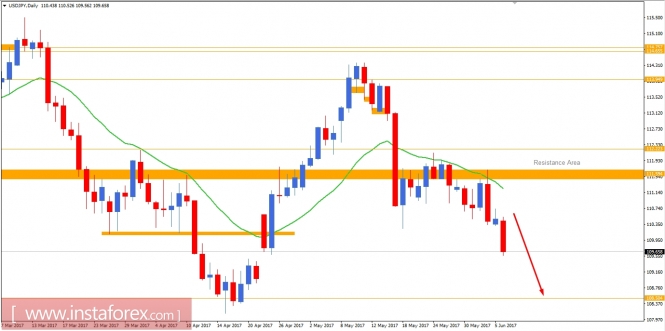 Read more: https://www.instaforex.com/forex_analysis/92601 |
| Re: News And Technical Analysis From Instaforex by Instaforexbuk(f): 2:58pm On Jun 07, 2017 |
Fundamental Analysis of USD/CAD for June 7, 2017 USD/CAD is currently trading inside a range between 1.3410 to 1.3540 area. Currently we can see some bearish pressure in the market due to recent USD negative reports. Today, the economic calendar contains the Canadian Building Permits report is an excellent barometer of future construction activity because obtaining a permit is the first step of constructing a new building and further development in the economy. The Canadian Building Permit report today is expected to be positive at 2.4%, much stronger than -5.8% previously. On the USD side, the US Energy Department is due to release Crude Oil Inventories report which is expected to show a less drawdown by -3.1M barrels which previously was at -6.4M. The US report is not the first-tier news to overcome the Canadian Building Permits report. Nevertheless, the reports are to bring in higher volatility in the market today. If the Canadian news comes better or equal to the consensus, CAD is expected to gain further against USD in the coming days. Now let us look at the technical chart. The price is currently showing some bearish pressure in the range of 1.3410 to 1.3540 area. The selling pressure is still not quite strong as expected as 1.3410 is not yet taken out with a daily close below it. So if the price takes out 1.3410 with a daily close we will be looking forward to sell with a target towards 1.3260 support level. 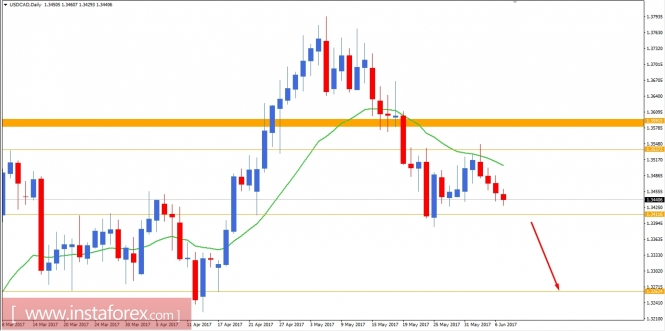 Read more: https://www.instaforex.com/forex_analysis/92657 |
| Re: News And Technical Analysis From Instaforex by Instaforexbuk(f): 3:32pm On Jun 08, 2017 |
Fundamental Analysis of EUR/AUD for June 8, 2017 This week EURAUD had numbers of impulsive bearish move bouncing off from 1.5025 to currently at the edge of 1.4880 support level. Today AUD had negative Trade Balance report with the worst figure at 0.56B which was expected to be at 1.91B. Previously the Trade Balance was at 3.17B and with that aspect, a decrease in Trade Balance report indicates the decrease in Export Demand of the products as well as the currency and it also impacts the production and prices at the domestic manufacturers. Despite having worst Trade Balance report AUD is seen to continue its gain till now against EUR today. On the other hand, today Eurozone had a series of positive reports till now like German Industrial Production was published at 0.8% which was expected to be at 0.6%, French Trade Balance was published with a better figure at -5.5B which was expected to be at -5.9B and Revised GDP also showed rise to 0.6% which was expected to be unchanged at 0.5%. Moreover, today Eurozone Minimum Bid Rate report is going to be published which is expected to be unchanged at 0.00% and along with that ECB President Draghi is going to have a speech today about the policy decisions and recent interest rate. During the event, a good amount of volatility is expected to hit the market and provide direction about the upcoming move in the market in the coming days. Now let us look at the technical view, the price is currently in a non-volatile bearish trend and it has already broken below the 20 EMA support with a daily close. Currently, the price is just at the edge of 1.4880 support level and today if we see a daily close below the 1.4880 support we will be looking forward to selling 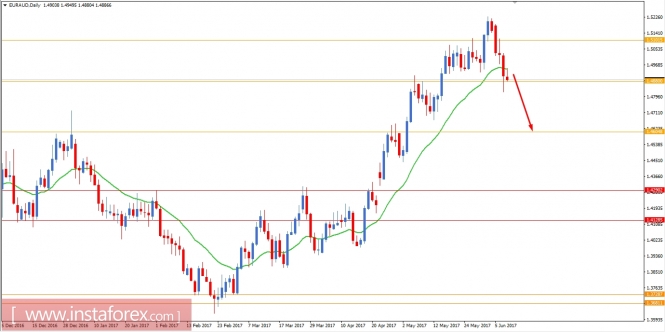 Read more: https://www.instaforex.com/forex_analysis/92719 |
| Re: News And Technical Analysis From Instaforex by Instaforexbuk(f): 3:17pm On Jun 09, 2017 |
Fundamental Analysis of EUR/GBP for June 9, 2017 EUR/GBP showed a great amount of bullish pressure from the first hour today. It moved 140+ pips in an hour bouncing off from 0.8650 to 0.8820. Recently Pound had been suffering from Brexit vote and currently from the General Election effects. The pound is currently quite weaker and it may cause the households to suffer from rising inflation and damaging growth forecasts. Theresa May from the Conservative Party is currently leading in the General Election with 46.9% votes ahead of Jeremy Corbyn from the Labour Party with 39.5% votes. Though the election results are yet to be published we have already observed weakness of the Great British Pound in the market today. Additionally, GBP Manufacturing Production report is going to be published today which is expected to rise to 0.8% from -0.6% previously, Goods Trade Balance is expected to be at -12.0B decreasing from -13.4B, Construction Output is expected to be positive at 0.5% from -0.7% previously and Industrial Production report is also expected to show a rise to 0.7% from -0.5%. Today GBP economic events are quite optimistic in nature which might help the Pound to gain some strength but the market is still under consolidation as of the election results to be published soon. On the EUR side, German Trade Balance is going to be published today which is expected to rise to 20.3B from 19.6B, French Industrial Production report is expected to decrease to 0.3% from 2.0% and Italian Quarterly Unemployment Rate is expected to show a decrease in the unemployment rate to 11.6% from 11.9%. To sum up, a good amount of volatility is going to strike the market despite the optimistic economic events on the both currencies and as of the current situation Pound is expected to lose some grounds today against Euro. Now let us look at the technical view, the price has bounced off the 20 EMA dynamic support level today at the first hour of the market. Currently, the price has already engulfed price actions of the previous number of days and as the price remains above the 20 EMA it is expected that the price will head towards 0.8850 resistance soon. The structure of the currency pair is still residing inside the corrective structure and a break above 0.8850 will signal a further bullish move in this pair in the coming days. 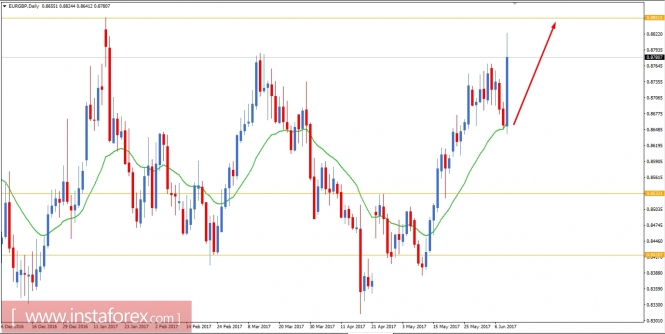 Read more: https://www.instaforex.com/forex_analysis/92757 |
| Re: News And Technical Analysis From Instaforex by Instaforexbuk(f): 4:45pm On Jun 12, 2017 |
Technical analysis of GBP/JPY for June 12, 2017 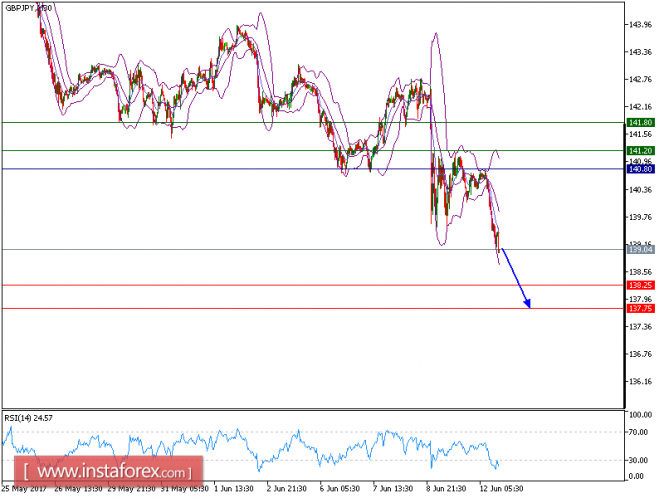 All our targets which we predicted on Friday have been hit. GBP/JPY is still expected to trade in a lower range as key resistance lies at 140.80. The pair is trading below the key resistance at 140.80, which should limit the upside potential. The relative strength index is mixed with a bearish bias. The British pound tumbled to the low level, when Prime Minister Theresa May announced the June 8 snap election as a result of which the ruling Conservative Party unexpectedly lost its majority in Parliament. Hence, as long as 140.80 holds on the upside, look for a return to 138.25. A break below this level would trigger a further drop to 137.75 in extension. Alternatively, if price moves in the opposite direction as predicted, long position is recommended above 140.80 with targets at 141.20 and 141.80. Graph Explanation: The black line shows the pivot point, present price above pivot point indicates the bullish position and below pivot points indicates the short position. The red lines show the support levels and the green line indicates the resistance levels. These levels can be used to enter and exit trades. Strategy : SELL, Stop Loss: 140.80, Take Profit: 138.25 Resistance levels: 141.20, 141.80, and 142.45 Support levels: 138.25,137.75, and 137 Read more: https://www.instaforex.com/forex_analysis/92843 |
| Re: News And Technical Analysis From Instaforex by Instaforexbuk(f): 2:03pm On Jun 13, 2017 |
Technical analysis of EUR/USD for June 13, 2017 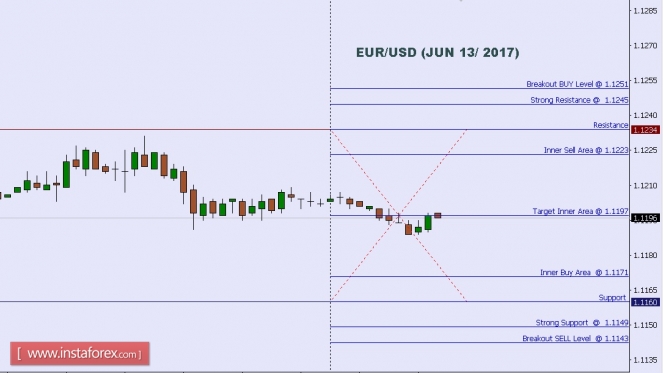 When the European market opens, some Economic Data will be released, such as ZEW Economic Sentiment, German ZEW Economic Sentiment, German WPI m/m, and French Final Non-Farm Payrolls q/q. The US will release the Economic Data, too, such as 30-y Bond Auction, Core PPI m/m, PPI m/m, and NFIB Small Business Index, so, amid the reports, EUR/USD will move in a low to medium volatility during this day. TODAY'S TECHNICAL LEVEL: Breakout BUY Level: 1.1251. Strong Resistance:1.1245. Original Resistance: 1.1234. Inner Sell Area: 1.1223. Target Inner Area: 1.1197. Inner Buy Area: 1.1171. Original Support: 1.1160. Strong Support: 1.1149. Breakout SELL Level: 1.1143. Disclaimer: Trading Forex (foreign exchange) on margin carries a high level of risk, and may not be suitable for all investors. The high degree of leverage can work against you as well as for you. Before deciding to invest in foreign exchange you should carefully consider your investment objectives, level of experience, and risk appetite. The possibility exists that you could sustain a loss of some or all of your initial investment and therefore you should not invest money that you cannot afford to lose. You should be aware of all the risks associated with foreign exchange trading, and seek advice from an independent financial advisor if you have any doubts. Read more: https://www.instaforex.com/forex_analysis/92873 |
| Re: News And Technical Analysis From Instaforex by Instaforexbuk(f): 4:22pm On Jun 14, 2017 |
Fundamental analysis of EUR/GBP for June 14, 2017 EUR/GBP has recently rejected the resistance at 0.8850 in a non-volatile bullish trend. GBP is likely to extend gains on the back of positive CPI report which was published at 2.9% versus the expected level at 2.7%. Along with CPI report, Core CPI, RPI and HPI reports were also positive which provided support to GBP. Today the UK Average Earning Index is going to be published. It is expected to be unchanged at 2.4%. Besides, the Claimant Count Change is expected to decrease to 12.5k from 19.4k previously and the unemployment rate is expected to be unchanged at 4.6%. With a heavy economic calendar today, a good amount of volatility will likely hit the market and we might see further gains on the GBP side against EUR. In the eurozone side, the German Final CPI was published with an unchanged figure at -0.2% which was expected to be positive at 0.5% so GBP rose further against EUR. The Eurozone Employment Change report is also going to be published which is expected to be unchanged at 0.3%. Along with it, the industrial production data is likely to show an increase to 0.5% from -0.1%. The eurozone economic reports are not quite important today so they will not create much volatility. Therefore, GBP is expected to gain further against EUR in the coming days despite the bullish trend in the pair. Now let us look at the technical view. The price has bounced from the resistance at 0.8850 which was also touched in January 2017. After that the price moved lower towards 0.8300 area. Currently, the price is showing bearish impulsive movement which is expected to continue till 0.8700 area at 20 EMA support. If 20 EMA support is broken below at a daily close, we will be looking forward for further down move towards 0.8530-0.8420 support area. As the price remains below 0.8850, bearish bias is expected to continue in this pair. 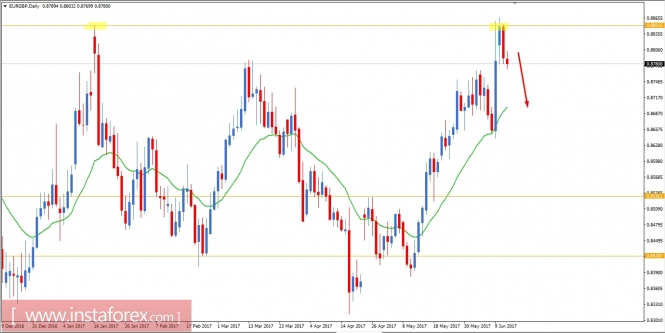 Read more: https://www.instaforex.com/forex_analysis/92937 |
| Re: News And Technical Analysis From Instaforex by Instaforexbuk(f): 4:17pm On Jun 15, 2017 |
Fundamental Analysis of AUD/USD for June 15, 2017 AUD/USD is currently trading in a bullish bias after breaking above the resistance of 0.7550. Today, we have seen a good amount of exhaustion in this pair in light of two high impact economic events. Today, the US FOMC Statement was released after the Federal Funds Rate had been lifted to 1.25% from previous rate of 1.00%. The decision provided USD with fresh impetus against AUD. However, a few hours later since the reports on AUD Employment Change and Unemployment Rate report were published, USD shed all its gains. Today Australian Employment Change showed a positive change to 42.0k, much stronger than the expected 9.7k rise and Unemployment Rate was also decreased to 5.5% which was expected to be unchanged at 5.7%. Currently, the market is correcting itself after the exhaustion. Moreover, today RBA Assist Gov. Debelle is due to speak about nation's key interest rate and future policy shifts. Besides, US Unemployment Claims is due to be published which is expected to decrease to 241k from 245k previously. These events are likely to bring in good volatility in the market and provide a signal for an upcoming move of this pair. Now let us look at the technical chart. The price is currently above the resistance area of 0.7500-50. As the price remains above the resistance area, a further bullish move is expected in this market to reach 0.7750 level. Because of the positive Employment Change and Unemployment Rate report today, the Australian dollar is quite stronger and expected to gain more in the coming days. We might see some corrective structures along the way to 0.7750 and a bullish bias is expected to remain intact until the price breaks below 0.7500 level with a daily close. 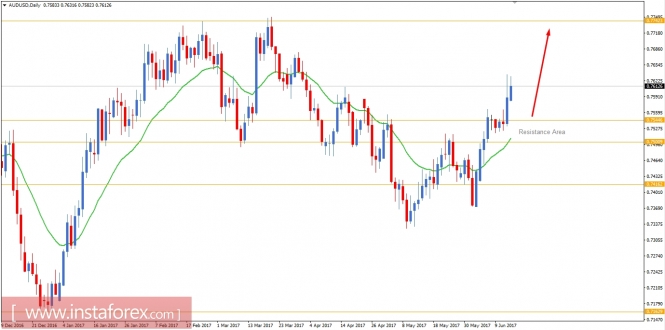 Read more: https://www.instaforex.com/forex_analysis/92983 |
| Re: News And Technical Analysis From Instaforex by Instaforexbuk(f): 4:24pm On Jun 22, 2017 |
Technical analysis of NZD/USD for June 22, 2017 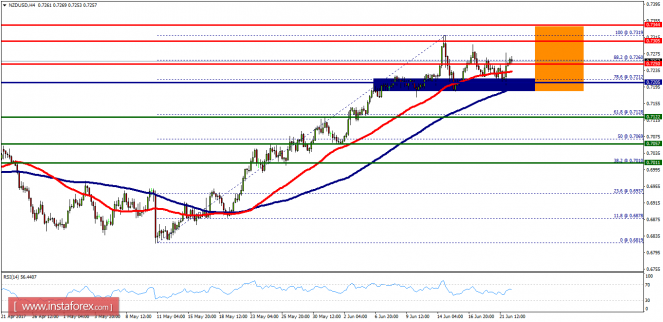 Overview: The NZD/USD pair is showing signs of force following a breakout of the highest price of 0.7205 (a major support). The NZD/USD pair will continue rising from the level of 0.7205 in the long term. It should be noted that the support is established at the level of 0.7205 which represents the daily pivot point on the H4 chart. Currently, the price was in a bullish channel since two days. This is confirmed by the RSI indicator signaling that we are still in a bullish trending market. So, the NZD/USD pair continues to move upwards from the level of 0.7205. As long as the trend is above the price of 0.7205, the market is still in an uptrend. In addition, the trend is still strong above the moving average (MA100). The NZD/USD pair didn't make any significant movements last two days. The market is indicating a bullish opportunity above the mentioned support levels. The bullish outlook remains valid as long as the 100 EMA heads for the upside. Therefore, strong support will be found around the spot of 0.7159-0.7205 providing a clear signal to buy with a target seen at 0.7250. If the trend breaks the first resistance at 0.7250, the pair will move upwards continuing the bullish trend development to the level of 0.7305 in order to test the daily resistance 2. It should be noted that the major resistance is seen at 0.7344 today. On the other hand, it would also be wise to consider where to place a stop loss; this should be set below the second support of 0.7128 (61.8% Fibonacci retracement levels). Read more: https://www.instaforex.com/forex_analysis/93278 |
| Re: News And Technical Analysis From Instaforex by Instaforexbuk(f): 4:18pm On Jun 23, 2017 |
Analysis of gold for June 23, 2017 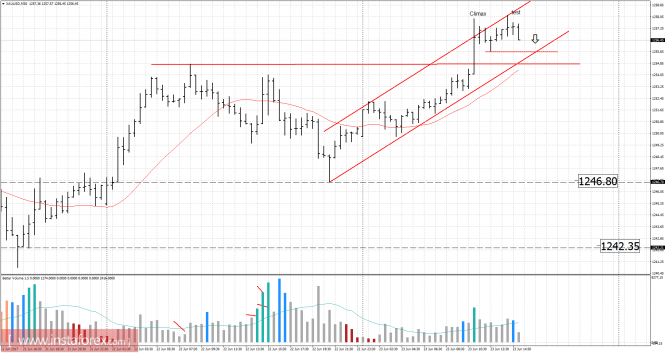 Recently, gold has been trading upwards. The price tested the level of $1,258.00. Anyway, according to the 30M time frame, I found a climatic action followed by no demand bars, which is a sign that buying looks risky. The price also tested upper diaognal of channel, which is another sign of potential wekaness. My advice is to watch for potential selling opportunities. The downward targets are set at $1,247.00 and $1,243.00. Resistance levels: R1: $1,254.30 R2: $1,256.50 R3: $1,260.00 Support levels: S1: $1,247.00 S2: $1,245.00 S3: $1,241.00 Trading recommendations for today: watch for potential selling opportunities. Read more: https://www.instaforex.com/forex_analysis/93342 |
| Re: News And Technical Analysis From Instaforex by Instaforexbuk(f): 4:27pm On Jun 28, 2017 |
EUR/USD analysis for June 28, 2017 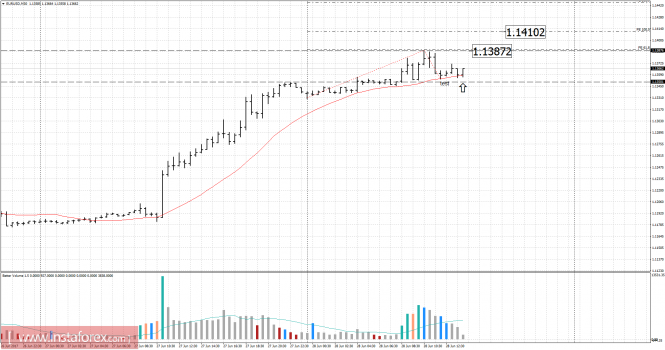 Recently, the EUR/USD pair has been trading upwards. The price tested the level of 1.1388 in a ultra high volume. According to the 30M time frame, I found a successful test of supply in a low volume, which is a sign that the price is heading for higher levels. My advice is to watch for potential buying opportunities. I have placed Fibonacci levels to find potetnial upwards targets. The upward targets are set at the prices of 1.1385 and 1.1410. Resistance levels: R1: 1.1385 R2: 1.1410 R3: 1.1430 Support levels: S1: 1.1345 S2: 1.1320 S3: 1.1300 Trading recommendations for today: watch for potential buying opportunities. Read more: https://www.instaforex.com/forex_analysis/93484 |
| Re: News And Technical Analysis From Instaforex by Instaforexbuk(f): 1:52pm On Jun 29, 2017 |
Fundamental Analysis of EUR/GBP for June 29, 2017 EUR/GBP is currently struggling at the edge of 0.8850 as of Hawkish Statement of ECB President Draghi and Bank of England President Carney signaling Interest Rate hike considering the upcoming economic global economic boom. Today EUR GfK German Consumer Climate report was published with a slightly better figure at 10.6 which was expected to be unchanged at 10.4, Spanish Flash CPI report was published with the worst figure at 1.5% which was expected to be at 1.6% decreasing from previous value of 1.9% and German Prelim CPI report is yet to be published which is expected to rise to 0.0% from previous value of -0.2%. On the GBP side, today Net Lending to Individuals report showed an increase to 5.3B which was expected to be at 4.0B, M4 Money Supply was published with a negative figure of -0.1% which was expected to be unchanged at 1.3% and Mortgage Approvals was published with an unchanged figure of 65K which was expected to decrease to 64k. To sum up, both currencies are in top form fighting for establishing a trend in the market where GBP is expected to have an upper hand due to Rate Hike bias in the market. Now let us look at the technical view, the price has rejected off the resistance of 0.8850 and currently being held by 20 EMA as a support. If the price breaks below 20 EMA with a daily close then we will be looking forward to selling with a target towards 0.8550 support level. On the other hand, if the price breaks above 0.8850 with a daily close above it, we will be looking forward to buying with a target towards 0.90 in the coming days. Currently, the market is in bullish bias until price breaks below 20 EMA with a daily close. 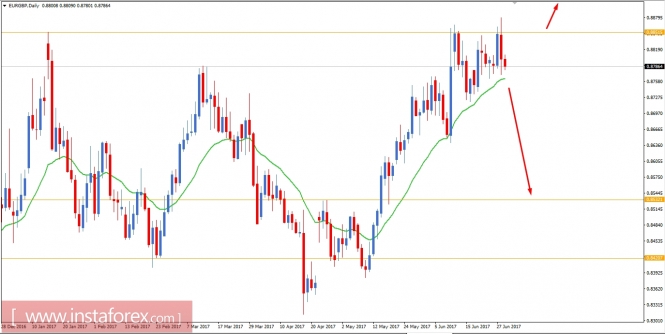 Read more: https://www.instaforex.com/forex_analysis/93558 |
| Re: News And Technical Analysis From Instaforex by Instaforexbuk(f): 2:38pm On Jun 30, 2017 |
Global macro overview for 30/06/2017 Upbeat data from the US economy did not prevent the US Dollar from falling. The Final GDP data from the US was revised up to 1.4% from 1.2%, mainly due to better indicators of personal consumption expenditure, which hit a level of 1.1% from the low of 0.6% (but there was a small downward revision to investment growth for the quarter). The net exports were revised higher and the government spending was estimated to have contracted at a slower rate. The GDP Price Index was revised down to 1.9% from the previous estimate of 2.2% and this might trigger some uncertainty regarding the inflationary pressures. At the last FOMC meeting, Chairperson Jannet Yellen still remained dovish and data-dependent in her monetary policy statements.The FED policy members still planning at least two interest rate hikes this year. However, if the underlying inflationary pressures will not rise fast enough, markets might start to feel disappointed as the hike will not be justified by the fundamentals. This is why the FED prefers to wait for more data before making any decision regarding the interest rate hike. Therefore, the next hike might be expected not in September 2017 but in December 2017, just before the year's end. Let's now take a look at the US dollar index technical picture on the H4 time frame. The inflow of positive data from the US does not contribute to the strength of the dollar in the foreign exchange market, which assumes superiority to almost all G10 currencies. The price has violated the important technical support at the level of 95.91 and made a low at the level of 95.47 in oversold market conditions. The bias remains to the downside. 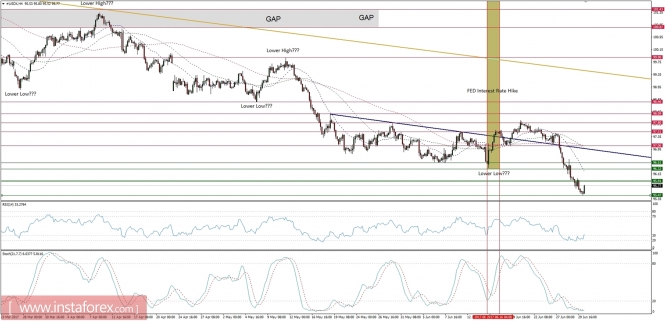 Read more: https://www.instaforex.com/forex_analysis/93606 |
| Re: News And Technical Analysis From Instaforex by Instaforexbuk(f): 3:09pm On Jul 03, 2017 |
Technical analysis of GBP/JPY for July 3, 2017 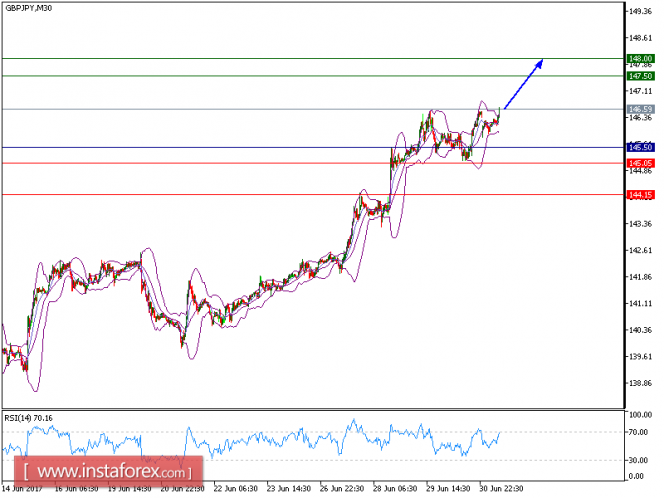 GBP/JPY is expected to trade with a bullish bias. The pair is currently testing the support of its 50-period moving average, and remains above the horizontal support at 127.80. The 20-period moving average still remains above the 50-period moving average, and the relative strength index is around its neutrality area at 50, lacking downward momentum. As long as 145.50 is not broken down, further advance is preferred with 147.50 and 148.00 as targets. Alternatively, if the price moves in the opposite direction as predicted, a short position is recommended below 145.50 with the target at 145.05. Chart Explanation: the black line shows the pivot point. The price above pivot point indicates the bullish position and when it is below pivot points, it indicates a short position. The red lines show the support levels and the green line indicates the resistance levels. These levels can be used to enter and exit trades. Strategy: BUY, Stop Loss: 145.40, Take Profit: 147.50. Resistance levels: 147.50, 148.00, and 148.50 Support levels: 145.05, 144.15, and 143.15 Read more: https://www.instaforex.com/forex_analysis/93664 |
| Re: News And Technical Analysis From Instaforex by Instaforexbuk(f): 3:33pm On Jul 04, 2017 |
USD/CHF testing major resistance, prepare to sell The price is now testing major resistance at 0.9645 (Fibonacci retracement, horizontal overlap resistance) and we expect a strong reaction from this level for a drop towards 0.9552 support (Fibonacci extension, horizontal swing low support). Stochastic (34,5,3) is testing major resistance at 97% where we expect a drop from. Sell below 0.9645. Stop loss at 0.9677. Take profit at 0.9552. 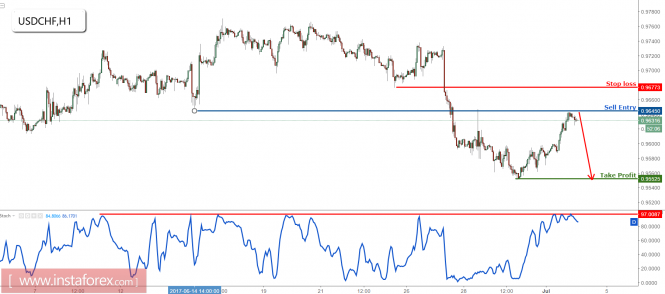 Read more: https://www.instaforex.com/forex_analysis/93732 |
| Re: News And Technical Analysis From Instaforex by Instaforexbuk(f): 2:59pm On Jul 05, 2017 |
USD/CHF testing major resistance, prepare to sell Price is now testing major resistance at 0.9645 (Fibonacci retracement, horizontal overlap resistance, bearish divergence) and we expect a strong reaction from this level for a drop towards 0.9552 support (Fibonacci extension, horizontal swing low support). Stochastic (34,5,3) is testing major resistance at 97% where we expect a drop from. We can also see that bearish divergence has formed vs price signalling that a reversal is impending. Sell below 0.9645. Stop loss at 0.9677. Take profit at 0.9552. 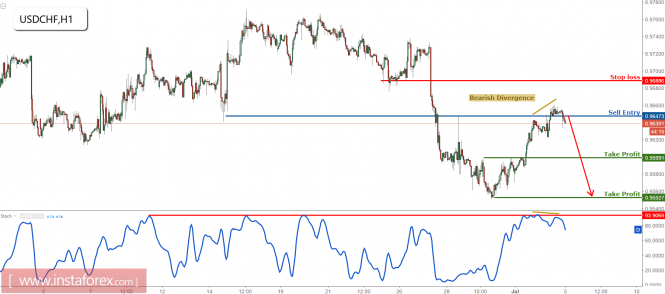 Read more: https://www.instaforex.com/forex_analysis/93786 |
| Re: News And Technical Analysis From Instaforex by Bolutumiii(m): 3:21pm On Jul 05, 2017 |
Hi, pls what are the terms and conditions for instaforex free 500USD account. |
| Re: News And Technical Analysis From Instaforex by Instaforexbuk(f): 3:11pm On Jul 06, 2017 |
[size=14pt]USD/JPY analysis for July 06, 2017 [/size] 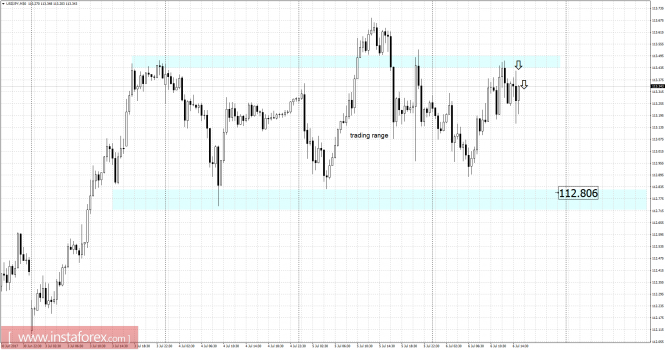 Recently, the USD/JPY has been trading sideways at the price of 113.27. According to the 30M time frame, I found a trading range between the price of 113.50 (resistance) and the price of 112.80 (support). The price successfully tested resistance and my advice is to watch for potential selling opportunities. The downward target is set at the price of 112.80. Resistance levels: R1: 113.70 R2: 114.15 R3: 114.60 Support levels : S1: 112.80 S2: 112.35 S3: 111.90 Trading recommendations for today: watch for potential selling opportunities. Read more: https://www.instaforex.com/forex_analysis/93882 |
| Re: News And Technical Analysis From Instaforex by Instaforexbuk(f): 5:47pm On Jul 06, 2017 |
Bolutumiii: @Bolutumiii this are the terms and conditions for the $500 start up bonus: The campaign applies to Standard USD, US Cent or Standard EUR, EUR Cent accounts opened from 10/06/2017, excluding MT5 accounts. Every client of InstaForex is eligible for the StartUp bonus if: - the current balance on each of his accounts doesn't exceed $10 for the last month (including bonus funds); - during the last 6 months, the volume of trade on any of the client's accounts didn't exceed 0.3 InstaLots (or 30 lots for Cent Accounts); - during the last 6 months, the total deposit to any of the client's accounts never exceeded $10. Check bonus amount. StartUp Bonus is compatible with 30% bonus. Profit is allowed for withdrawal only for completely verified accounts. At the same time, when making a withdrawal request the Client must send a portrait photo with the document in the hand provided for verification to finance@mail.instaforex.com. The information in the document must be legible. Account number must be specified in the message as well. When opening an account which will be used to receive the StartUp Bonus, the Client is required to specify data that coincides with the data in the documents that he provides for the verification of the account. After crediting the bonus, it is prohibited to change such personal data of the account as the full name and country, therefore it is strongly recommended that the Client learns the rules of verification in advance and pay careful attention to these fields. The client agrees that after the profit becomes more than 10% of the amount of the StartUp Bonus, all the client's transactions are closed, the trade is stopped, the bonus is written off, the profit is canceled and the amount equal to 10% of the bonus is credited. Also an record with a comment is added: TRADE YYY LOTS TO W / D BONUS. Where YYY = X * 3, where X is the WITHDRAWABLE PROFIT FROM BONUS. The record MAKE DEPOSIT TO CONTINUE TRADE and MINIMUM DEPOSIT XX $ is added to the account history, where XX is the bonus amount * 10%. The withdrawal of the profits from the accounts with StartUp Bonus is carried out depending on the ratio of the number of bonus funds to the total amount of funds on the account balance. The company reserves the right to cancel the StartUp Bonus without prior notice. The leverage for clients who received the StartUp Bonus is 1:50. The leverage can be changed only after the account is replenished. The stop out level for these accounts is 100%. The StartUp Bonus cannot be invested but can be used to copy trades. The client agrees that in the event the company suspects any fraud activity involving the bonus, the latter can be declared void and the trading result can be annulled. Clients who have received the StartUp Bonus to their trading accounts cannot participate in rebate-programs. The Company reserves the right to amend or modify the campaign terms without prior notice. 1 Like |
| Re: News And Technical Analysis From Instaforex by Instaforexbuk(f): 3:20pm On Jul 07, 2017 |
[size=18pt] Anticipation of the Labor Market Data Again [/size] The content of ECB's minutes of the meeting on monetary policy was not surprising. Today, we expect a slowdown in UK house price growth from 3.3% to 3.1% and this is clearly negative for the pound. Despite the fact that yesterday's data was very weak, the market remains hopeful on today's labor market data. If the labor market forecasts are confirmed, the EUR / USD pair fell to 1.1330. 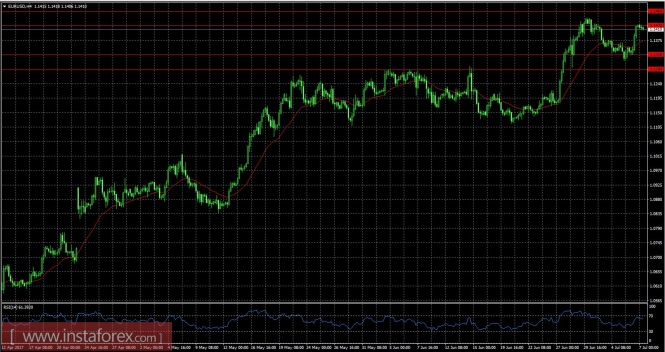 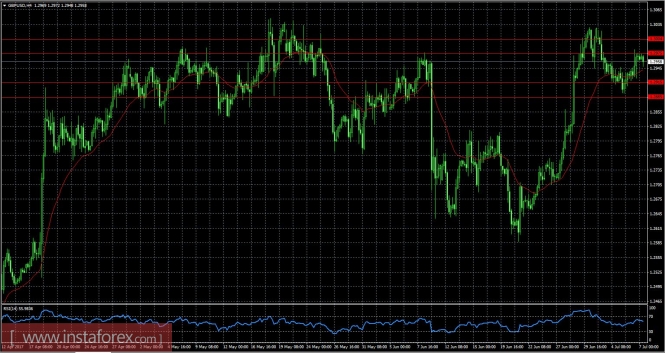 |
| Re: News And Technical Analysis From Instaforex by Instaforexbuk(f): 3:08pm On Jul 10, 2017 |
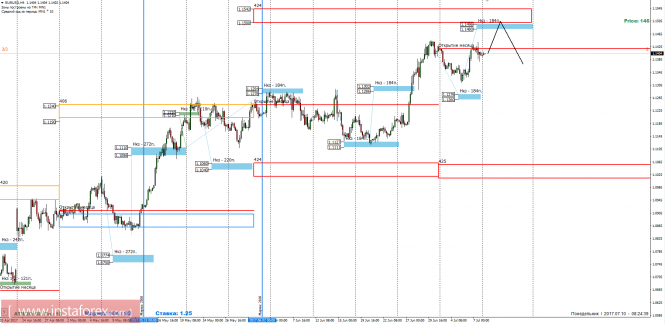
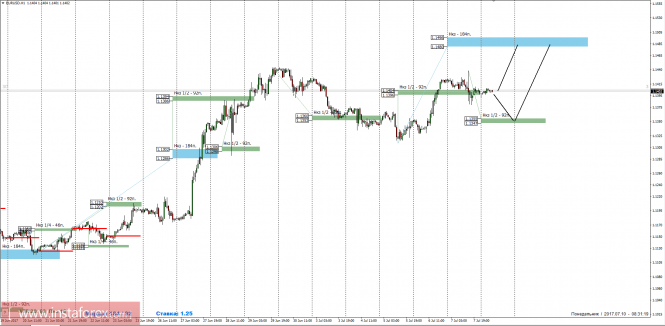
[size=150]Trading Forecast for EURUSD 07/10/2017 [/size] The opening price of this week occurred near the opening point of the previous week, which indicates the formation of a medium-term accumulation zone. Growth remains as the priority, and its purpose is a rise of a weekly short-term period of 1.1496-1.1480. The medium-term plan. The retention of the fall of the first half of the previous week speaks in favor of the sustained growth in the medium term. The probability of testing a June high is 70%. The main goal of growth is a weekly short-term plan of 1.1496-1.1480. The test of this zone will allow you to fix the next part of buying. It is important to note that a little higher than the weekly short-term is a monthly short-term decline of June at 1.5442-1.1500. The test of this zone can lead to a formation of a correctional or a reversal pattern of a higher order. Buying near this zone is not recommended. [Img]https://forex-images.ifxdb.com/userfiles/20170710/analytics59630fc118d08.png [/img] The alternative model will develop if the pair can gain a foothold above 1.1496 by the end of this week. This will allow a possibility of a continuation of growth in the medium term and the absence of large limit orders to sell. Intraday plan. At the end of last week, another momentum was formed to strengthen the euro. The breakdown of 1.1404-1.1396 speaks well for sustained growth. The main support is 1.1355-1.1347. As long as the pair is trading above this zone, the target continues to be at 1.1496-1.1480, the probability of the test is 70%. To cancel the upward movement, it will be necessary to close one of the U.S. sessions at a level below 1.1347. This will open the way for the formation of a downward momentum pattern. [Img]https://forex-images.ifxdb.com/userfiles/20170710/analytics5963113fc9e7f.png [/img] Day - day control zone. The band formed by important data from the futures market, which changes several times a year. Week - week control zone. The band formed by important marks of the futures market, which changes several times a year. Month - monthly inspection zone. The zone, which is a reflection of the average volatility over the past year. Read more: https://www.instaforex.com/forex_analysis/185765 |
| Re: News And Technical Analysis From Instaforex by Instaforexbuk(f): 3:37pm On Jul 11, 2017 |
USD/CHF profit target reached again, prepare to sell Price has continued its rise perfectly as expected and has reached our profit target again for the 3rd time in a row. We prepare to sell below 0.9679 resistance (Fibonacci extension, Fibonacci retracement, horizontal overlap resistance) for a drop towards 0.9630 support (Fibonacci retracement, horizontal swing low support). Stochastic (34,5,3) is seeing major resistance below 94% where we expect a drop from. Correlation analysis: EUR/USD and USD/CHF are strongly negatively correlated. Hence it is good that we expect a drop on USD/CHF and a bounce on EUR/USD as this shows that they are moving in tandem. Sell below 0.9679. Stop loss at 0.9701. Take profit at 0.9630. 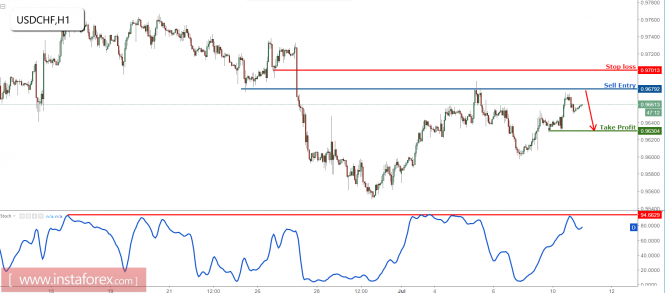 Read more: https://www.instaforex.com/forex_analysis/94179 |
| Re: News And Technical Analysis From Instaforex by Instaforexbuk(f): 3:10pm On Jul 12, 2017 |
Technical Analysis of the Crude Oil for July 12, 2017 4-hour timeframe 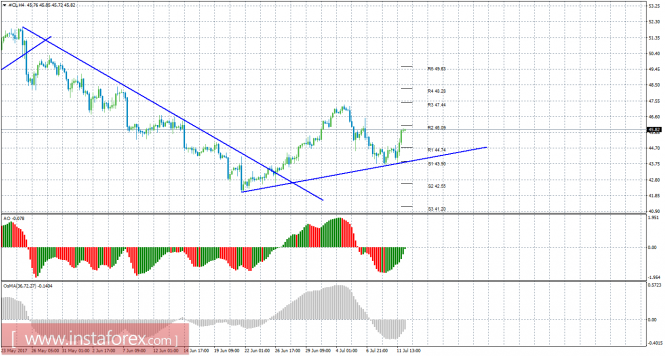 Analysis: Analysis of crude oil for July 12 shows that the price resumed its upward movement, after failing to break the first support level (S1). Trading recommendations: In the course of the oil price movement analysis, it can be concluded that purchasing of orders with targets of 46.09 and 47.44 are now possible. When entering a transaction between 80 to 130 profitability points, it is recommended to transfer the open transaction to break even. Aside from the technical aspect, traders should also consider the fundamental data and their scheduled releases. Explanation of illustration: Awesome Oscillator - red and green bars in the indicators window. OsMA - gray bars in the indicators window. Trend lines - blue lines. Support and Resistance - the red horizontal line. Read more: https://www.instaforex.com/forex_analysis/185979 |
| Re: News And Technical Analysis From Instaforex by Instaforexbuk(f): 3:20pm On Jul 13, 2017 |
[size=14pt]The Demand for the US dollar May Return [/size] The US dollar managed to strengthen its position against the European currency after the speech of Fed Chairman Janet Yellen, however, today's Asian session has undergone a steep correction. The speech of the Esther George, Federal Reserve President of the Kansas City, has cooled down investors sentiment who are expecting a further increase in interest rates of the Fed. Esther said that there is a need to reduce the balance, which should begin in the near future, since the current position of the Fed can result in financial imbalances. Also, in her opinion, it is important that the Fed allows long-term interest rates to grow since the committee does not have the capacity to lower rates, if necessary. According to the President of the Federal Reserve Bank of Kansas City, the cycle of raising interest rates has already started. Today, traders attention is focused on the speech of Janet Yellen who is already in front of the bank committee of the US Senate. If the Fed chairman sheds light on the new terms in raising interest rates, this will lead to a further increase of the US dollar. Let me remind you that, according to the Fed's plans, there is at least one more interest rate hike planned this year but there are a number of constraints. The chief of which is the recent slowdown in the inflation rate. To date, the probability of another rate hike in 2017 is estimated at about 52% against the previous 59% on Tuesday, according to the CME Group. As for the technical picture of the EURUSD pair, much will depend on the 1.1396 level and another decline would trigger several buyers to cancel stop orders which will collapse the trading instrument that is already in the range of new weekly support at 1.1350 and 1.1295. In the case of a repeated test of weekly resistance levels at 1.1470 and 1.1500 area, a breakout may occur that could lead to the formation of a new upward wave with an increase of the highs at 1.1560 and 1.1630. Today, the exports data from China was published during the Asian session, which has increased significantly in June this year. According to the official data from the Customs Administration of China, exports rose by 11.3% in June compared to the same period in the previous year, after rising 8.7% in May. The annual import growth in June was 17.2% following an increase of 14.8% in May. Economists expected imports to grow by 12.4% compared to the same period last year. The positive balance of foreign trade in China climbed to 42.77 billion US dollars.  Read more: https://www.instaforex.com/forex_analysis/186093 |
| Re: News And Technical Analysis From Instaforex by Instaforexbuk(f): 3:29pm On Jul 14, 2017 |
Global macro overview for 14/07/2017 Yesterday, FED Chairperson Jannet Yellen delivered the second part of the two-day semi-annual monetary policy testimony in front of the US Congress. She basically reiterated most of the points of her speech yesterday and answered the questions from the US Congress Committee, who had additional doubts about generating 3.0% growth by the Trump administration over the next two years. Moreover, the US Congress Committee expressed more doubts regarding the ability of the Trump administration to boost productivity through tax reform, which is linked to a rather insecure fiscal policy. Nevertheless, Yellen expressed her point of view regarding the FED's balance sheet reduction and plans to shrink them later this year. The trajectory of further rate hikes is still under the influence of further inflationary pressures, which was more dovish in the conclusion than expected. Later she admitted that the fed funds rate remains somewhat below its neutral level and "because the neutral rate is currently quite low by historical standards, the federal fund's rate would not have to rise all that much further to get to a neutral policy stance." It means the current economic factors that are preventing FED from faster interest rate hike are all transitory and will diminish somewhat over time. All in all, FED Chairperson indicated that the central bank policy makers want first to reduce the balance sheet and then continue with additional gradual rate hikes, which are likely to be still appropriate over the next few years. Currently, the biggest concern for FED is inflation, which is the key uncertainty and right now it is running below their target. It has declined recently. In conclusion, FED Chairperson Yellen gave some hints, that the September interest rate hike is off the table for now as the FED policymakers want to start to normalize the FED's $4.5 trn balance sheet accumulated since the financial crisis of 2007. Nevertheless, the gradual interest rate hikes are still possible later in 2017 if the economic data, especially inflation, will justify such a move. Let's now take a look at the SPY (SP500 ETF) technical picture on the H4 time frame. After Yellen's testimony, the index rallied to almost new highs but eventually was capped at the level of 244.50. The next technical support is seen at the level of 243.72 and the next technical resistance is seen at the level of 244.70 - 245.00 (all time highs). 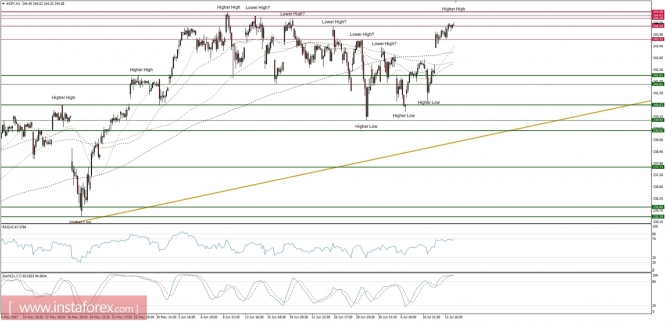 Read more: https://www.instaforex.com/forex_analysis/94435 |
| Re: News And Technical Analysis From Instaforex by Dollabiz: 5:21pm On Jul 14, 2017 |
Good |
| Re: News And Technical Analysis From Instaforex by Instaforexbuk(f): 3:25pm On Jul 17, 2017 |
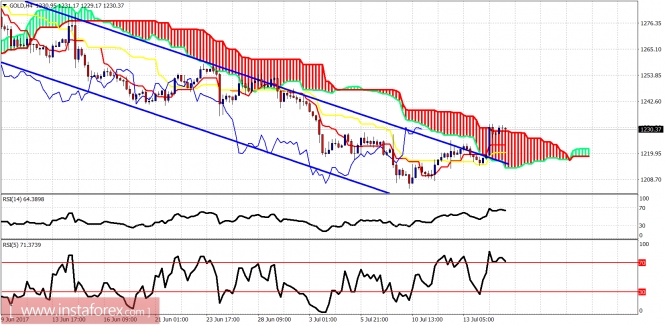
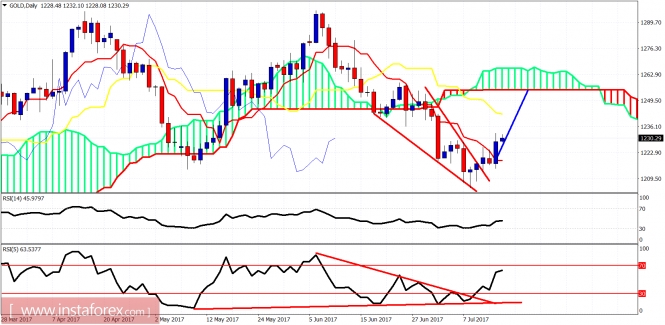
[size=150][color=#404000][Technical analysis of gold for July 17, 2017 color][/size] The Gold price as we expected has broken out of the bearish short-term channel. The trend has reversed to bullish and my minimum expected target is at $1,260 this week. There we could see a pull back but overall I believe a larger degree move higher has started. [Img]https://forex-images.ifxdb.com/userfiles/20170717/analytics596c69f48274e.jpg [/img] Blue lines - bearish channel The Gold price has broken out of the bearish channel and is trading above the Ichimoku cloud. The trend is bullish. Short-term support is at $1,215. Resistance is at $1,260. I expect Gold to reach $1,250-60 these weeks. [Img]https://forex-images.ifxdb.com/userfiles/20170717/analytics596c6a25c64a1.jpg [/img] Red lines - wedge pattern The Gold price has broken the wedge pattern upwards and the minimum target is the daily Kumo (cloud) level at $1,250-60. Breaking the wedge was timely notified by our analysis combined with the warning signs of the oversold conditions of the RSI (5). Read more: https://www.instaforex.com/forex_analysis/94530 |
| Re: News And Technical Analysis From Instaforex by Instaforexbuk(f): 2:29pm On Jul 18, 2017 |
Technical analysis of USDX for July 18, 2017 The Dollar index back tested the break down level at 95.50 and reversed back lower after being rejected at resistance. Price is now just above our 94.70 target. [Img]https://forex-images.ifxdb.com/userfiles/20170718/analytics596dbcda2a271.png [/img] Red line- resistance Blue line - support (broken) The trend is bearish. Target is 94.70 and was given once price broke below the blue horizontal support at 95.50. We were bearish since 96.30 where price could not break above the 4 hour Kumo. The trend has not changed since despite being given some weak signals of reversal. The reversal was never confirmed. On the contrary, the bearish trend signs were strengthened. 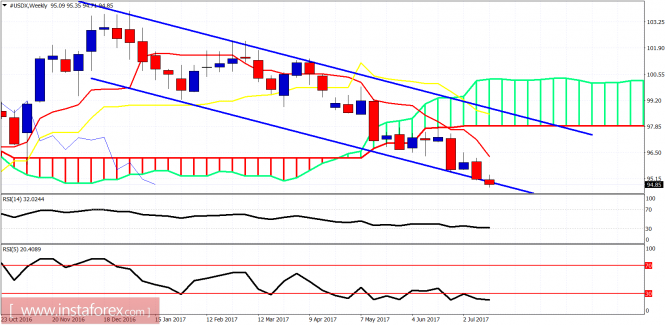 Blue lines - bearish channel The Dollar index remains inside the weekly bearish channel and below the weekly Kumo. The RSI (5) is oversold and diverging. This is not a reversal signal but a warning. Do not think it is the same. The trend remains bearish and there is no confirmation of a bullish reversal in any time frame. I continue to expect a bounce but price action continues to favor bears. Read more: https://www.instaforex.com/forex_analysis/94664 |
| Re: News And Technical Analysis From Instaforex by Instaforexbuk(f): 3:17pm On Jul 24, 2017 |
[size=18pt]USD/JPY analysis for July 24, 2017 [/size] 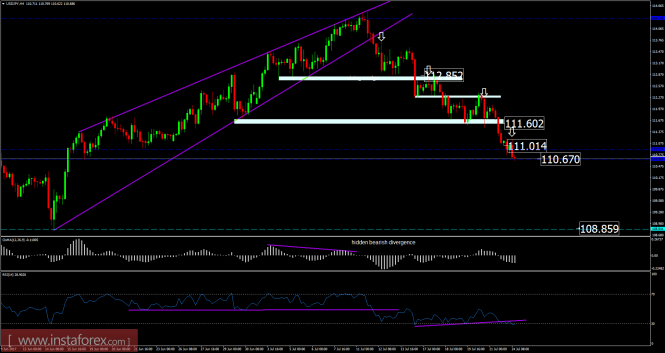 Recently, the USD/JPY has been trading downwards. The price tested the level of 110.62. According to the 4H time frame, I found that sellers are still in control and that breakout of rising wedge from a week ago was the main reason why sellers entered the market. My advice is still to watch for selling opportunities. I found lower high and lower lows, which is a sign that buying looks risky. The final downward target is set at the price of 108.85 (projected wedge target). Resistance levels: R1: 111.20 R2: 111.35 R3: 111.52 Support levels: S1: 110.85 S2: 110.70 S3: 111.55 Trading recommendations for today: watch for potential selling opportunities. Read more: https://www.instaforex.com/forex_analysis/95048 |
| Re: News And Technical Analysis From Instaforex by Instaforexbuk(f): 4:18pm On Jul 25, 2017 |
[size=18pt]Fundamental Analysis of GBP/USD for July 25, 2017 [/size] GBP/USD has been bullish recently due to bad economic reports on the USD side despite the political unrest and Brexit effect on the currency. Today GBP CBI Industrial Order Expectations report was published with a decreased figure at 10 from the previous figure at 16 which was expected to be at 12 and 30-y Bond Auction report was published at 1.83|2.2 which previously was at 1.67|2.1. On the USD side, today CB Consumer Confidence report is going to be published which is expected to decrease to 116.5 from the previous value of 118.9, HPI report is expected to decrease to 0.5% from the previous value of 0.7%, S&P/CS Composite-20 HPI report is expected to have a slight increase to 5.8% from the previous value of 5.7% and Richmond Manufacturing Index is expected to be unchanged at 7. Despite the bad economic reports on the GBP today the currency is currently showing some good gains over USD and expected to gain further in the coming days. Now let us look at the technical view, the price is currently residing above the resistance level of 1.3040 and if the price remains above the level with a daily close further bullish move towards 1.3370 is expected to reach 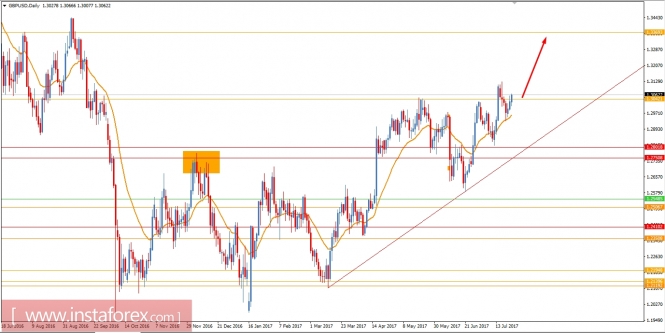 Read more: https://www.instaforex.com/forex_analysis/95188 |
| Re: News And Technical Analysis From Instaforex by Instaforexbuk(f): 3:00pm On Jul 26, 2017 |
[size=14pt] Technical analysis of gold for July 26, 2017 [/size] The Gold price got rejected just below the $1,260 level yesterday and has pulled back towards $1,245. Support is critical now at $1,243-$1,237 and if this level is broken we should expect a move at least towards $1,227. 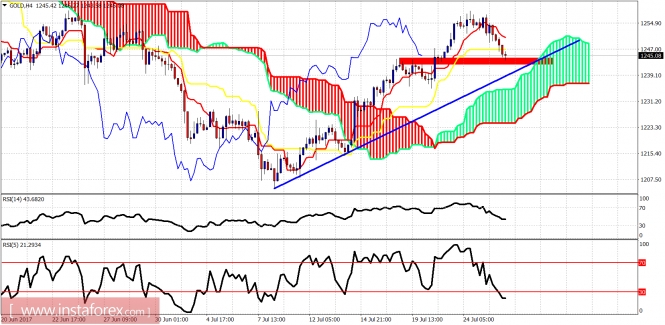 Red rectangle - support area Blue trend line - support The Gold price remains in a bullish trend as price is above the Kumo (cloud). Price is pulling back to back test the breakout area of $1,243-40. Holding above the red rectangle and the blue trend line will be a bullish sign and might bring in more buyers for another leg higher towards $1,275-80. 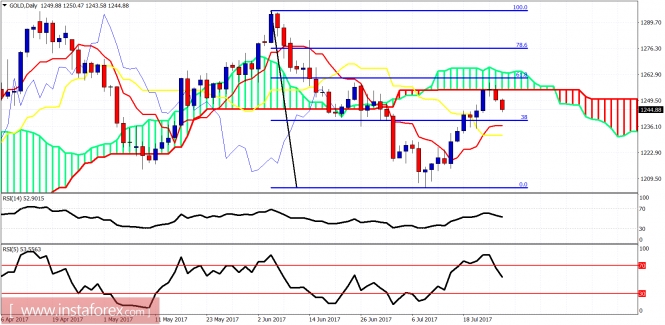 The Gold price got rejected at the Daily Kumo and near the 61.8% Fibonacci retracement of the decline. The daily trend remains bearish as long as the price is below the Kumo. Daily support is at $1,237-31. Resistance is at $1,257 and next at $1,265. Read more: https://www.instaforex.com/forex_analysis/95272 |
(1) (2) (3) ... (5) (6) (7) (8) (9) (10) (11) ... (23) (Reply)
ICPC Arrests Osun FCMB Manager Over New Naira Notes Policy Violation / Naira Depreciates To ₦410 Per Dollar As Local Currency Weakens / Kwik Cash Borrowing
(Go Up)
| Sections: politics (1) business autos (1) jobs (1) career education (1) romance computers phones travel sports fashion health religion celebs tv-movies music-radio literature webmasters programming techmarket Links: (1) (2) (3) (4) (5) (6) (7) (8) (9) (10) Nairaland - Copyright © 2005 - 2024 Oluwaseun Osewa. All rights reserved. See How To Advertise. 156 |