News And Technical Analysis From Instaforex - Business (9) - Nairaland
Nairaland Forum / Nairaland / General / Business / News And Technical Analysis From Instaforex (45813 Views)
Get Startup Bonus Of $500 To Trade From Instaforex / News And Technical Analysis From Superforex / News From Instaforex (2) (3) (4)
(1) (2) (3) ... (6) (7) (8) (9) (10) (11) (12) ... (23) (Reply) (Go Down)
| Re: News And Technical Analysis From Instaforex by Instaforexbuk(f): 3:48pm On Jul 27, 2017 |
[size=85]Global macro overview for 27/07/2017 [/size] The US Federal Reserve Bank (FED) decided to leave the interest rate unchanged at the level of 1.25%. The changes in the statement have been small and consistent with comments by FED members over the weeks since the June FOMC meeting. the statement released after the rate decision, the key phrase was: "The Committee expects to begin implementing its balance sheet normalization program relatively soon, provided the economy evolves broadly as expected". The market participants believe that "relatively soon" means, that an announcement will come in September. Inflation, meanwhile, has recently declined and is running below 2%, whereas in June it was running somewhat below 2%. At the same time, it was reaffirmed that the inflation target in the broader horizon was not threatened. That's a very subtle change in rhetoric, but not one which will scare US Dollar bears. The FED is also more optimistic about the labor market situation, assessing employment growth as "solid". After the FOMC statement, the market expectations regarding another rate hike in 2017 has dipped below 40%. The FOMC message went without surprises but did not stop the global investors from another round of US Dollar sell-off. This suggests that the market reaction had more to do with back to building a position for which the FOMC meeting was just an obstacle. Investors have been skeptical of the Dollar for a week, seeing fewer and fewer arguments (inflation weakness, fiscal policy failure) for the continuation of interest rate hikes in the Fed set the pace. It will be difficult to persuade the global investors to change its mind until we see a clear reversal on macro data, primarily on inflation. Let's now take a look at the US Dollar Index technical picture at the H4 timeframe. After the FOMC decision, the index fell to the level of 93.15 which is just above the technical support at the level of 93.03. The market conditions remain oversold, but the momentum still can not break out above the fifty level. [Img]https://forex-images.ifxdb.com/userfiles/20170727/analytics5979afc957b09.jpg [/img] Read more: https://www.instaforex.com/forex_analysis/95387 |
| Re: News And Technical Analysis From Instaforex by Instaforexbuk(f): 3:28pm On Jul 28, 2017 |
Daily analysis of GBP/JPY for July 28, 2017 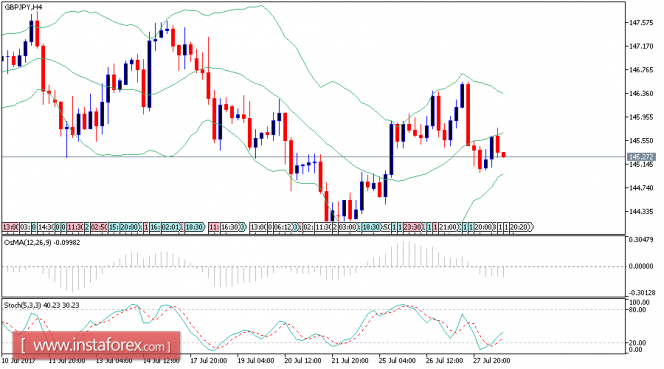 Overview The GBP/JPY pair repeated providing negative close below the main resistance level at 147.60 level, to confirm the domination of the bearish bias domination, by the above image, we notice stochastic attempt to form new bearish wave that opens the way towards gathering new negative momentum, which supports the attempt of renewing the negative attack, that targets 14.30 level as a first negative station, then wait until reaching the critical support at 141.40. Note that surpassing 144.60 level for today is important to confirm surpassing the sideways fluctuation, to open the way towards resuming the negative attack and achieving the suggested targets. The expected trading range for today is between 147.00 and 143.50. Read more: https://www.instaforex.com/forex_analysis/95526 |
| Re: News And Technical Analysis From Instaforex by jimnozi: 4:23pm On Jul 28, 2017 |
DO YOU KNOW YOU MAKE EXTRA INCOME Don't waist time again online busy doing nothing Turn your Laptop/Phone to Money Making Machine I mean Turning them to Your Office BECOME A SUCCESSFUL FOREX TRADER Its a REAL BUSHINESS THAT YOU CAN EVEN START WITH A LITTLE CAPITAL IF YOU ARE THE FEARFUL TYPE People Say u will Loose Yes its Through when you don't have Proper Training/Strategy AM telling you, You can make a living from this every month Training is free anywhere you are in the world Give it A try and see Trade every day and get Net Profit at the end of the month Come Get reliable signal and strategy to SUCCESSFUL FOREX TRADING why CAN'T YOU CONTACT ME NOW FOR MORE INFO Contact Me 07061941772 |
| Re: News And Technical Analysis From Instaforex by Instaforexbuk(f): 4:01pm On Jul 31, 2017 |
Wave analysis of the USD / CHF currency pair. Weekly review  Analysis of wave counting: At the beginning of last week's trading, the pair USD / CHF began a fairly dynamic pullback from the low on July 21, adding about 280 pp in price and finished the Friday session with the breakdown of the level of the 97th figure. Under the circumstances, it can be assumed that the currency pair has made another attempt to complete the formation of the entire wave e, C, C, (B) and yet designate the beginning of the future wave (C). At the same time, despite such a significant growth in quotations, there is a possibility of resuming the development of the downward movement and the next complication of the internal wave structure of the wave c, e, C, C, (B). Objectives for an upward wave option: 0.9801 - 76.4% by Fibonacci 0.9900 Objectives for a downward wave option: 0.9388 - 161.8% by Fibonacci 0.9300 General conclusions and trading recommendations: The wave counting of the instrument assumes the completion of the construction of the wave e, C, C, (B). If this assumption is correct, then the instrument can continue raising with targets located near the designated mark of 0.9801, which is equivalent to 76.4% Fibonacci, and above about 99 figures. The MACD convergence also speaks in favor of higher quotes, possibly within the wave (C). Read more: https://www.instaforex.com/forex_analysis/187094 |
| Re: News And Technical Analysis From Instaforex by trafftrade(m): 9:21pm On Jul 31, 2017 |
Am giving out over 40 premium courses on forex trade for a token to anyone who message me using my signature below |
| Re: News And Technical Analysis From Instaforex by Instaforexbuk(f): 3:45pm On Aug 01, 2017 |
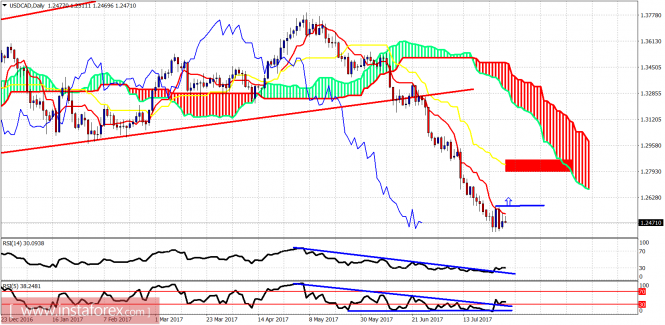
[color=#000040Technical analysis of USDCAD for August 1, 2017 ][/color] The USD/CAD pair has paused its strong decline just above 1.24 and shows signs of a possible reversal. The minimum bounce target is at 1.27 but if we get a confirmed reversal soon, I expect see this bounce to extend even towards 1.2850-1.29. 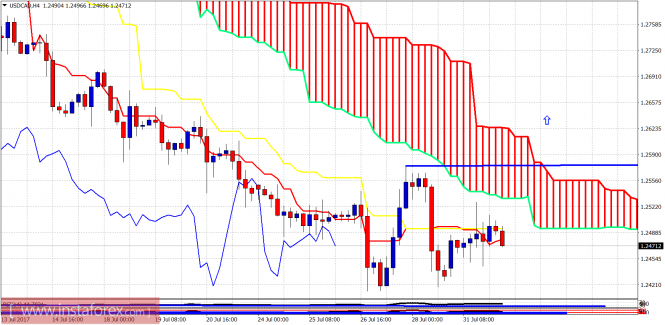 Blue line - resistance and trend reversal levels The short-term trend remains bearish as price is still below the 4 hour Kumo cloud. The short-term support lies at 1.24 while the resistance is found at 1.2575. The price has been moving sideways since 25th of July and bulls will need to break above the cloud and the recent high in order to confirm the change of trend . [Img] https://forex-images.ifxdb.com/userfiles/20170801/analytics59803371906e9.png[/img] Red rectangle - target area The daily oscillators are turning upwards from the oversold levels after showing bullish divergence signs. The trend remains bearish in the daily chart and only a daily close above the Tenkan-Sen (red line indicator) will be a bullish reversal confirmation. This price level is at 1.2530. Target for the reversal if it has already started lies at 1.28. Read more: https://www.instaforex.com/forex_analysis/95704 |
| Re: News And Technical Analysis From Instaforex by Instaforexbuk(f): 2:54pm On Aug 02, 2017 |
Daily analysis of USD/JPY for August 02, 2017 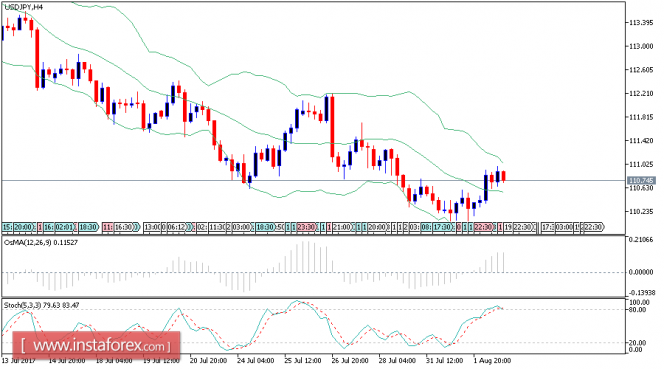 Overview The USD/JPY pair attempted to break 110.15 level yesterday but it couldn't hold below it, to rebound bullishly and heads potential test to 110.98 level, noticing that the EMA50 meets the mentioned resistance to add more strength to it, accompanied by stochastic reach the overbought areas. Therefore, we believe that the chances are valid to resume the bearish trend in the upcoming sessions, and the targets begin by breaking 110.15 level to open the way to head towards 108.80, reminding you that breaching 110.98 will lead the price to achieve more gains that target 112.32 areas mainly. The expected trading range for today is between 109.50 support and 111.20 resistance. Read more: https://www.instaforex.com/forex_analysis/95824 |
| Re: News And Technical Analysis From Instaforex by Instaforexbuk(f): 2:55pm On Aug 03, 2017 |
Global macro overview for 03/08/2017 Global macro overview for 03/08/2017: A set of PMI data from the US economy is ready for the release today. The ISM Non-Manufacturing PMI is expected to slide from 57.4 points to 56. 9 points in July. The Composite PMI is expected to stay unchanged at the level of 54.4 points, together with Final Services PMI at the 54.4 as well. All of the PMI's are anticipated to stay way above the fifty level. The IHS Markit reported last week, that "PMI survey respondents cited an improving economic backdrop and greater willingness to spend among clients in July. Reflecting this, the latest data revealed the strongest upturn in new work received by service sector firms for exactly two years". Today's data have a chance to confirm IHS Markit report and support the view, that outlook for moderate growth remains intact, even despite the expected slight decrease. The services sector is expanding at a healthy pace and this is an important indicator of a general economic growth in the US. One can not say the same about the internal and international US politics development. After the election, it seemed that the pillar of the predecessor's presidency - the Obamacare health system - would disappear very quickly. At present many analysts are wondering if it will disappear at all. The problem is the lack of agreement among Republican senators. Despite the majority of 52:48 they lost the vote on the liquidation of the Obamacare system. As a result of breaking up as many as 3 Senators, there is a conflict on the Senate - President line. More and more investors are doubting the effectiveness of the Trump administration. They are afraid not only of the lack of the mentioned reform but also the failure of subsequent treatments including changes in the tax system. The effect of this fear is an ongoing global investor escape from the US Dollar to other currencies. The greatest beneficiary of this trend is the euro, which since the election has strengthened against the US currency by more than 10%. Let's now take a look at the USD/JPY technical picture at the H4 timeframe. The price has failed to break back above the golden trend line around the level of 111.00 and reversed back below 61%Fibo level resistance. Despite the oversold market conditions, the market is unable to rally above the nearest resistance. The next technical support is seen at the level of 109.85. 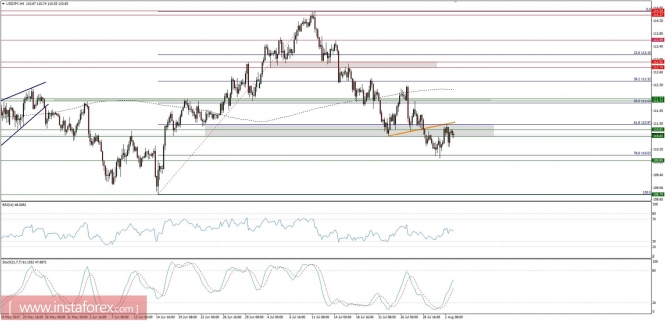 Read more: https://www.instaforex.com/forex_analysis/95866 |
| Re: News And Technical Analysis From Instaforex by Instaforexbuk(f): 2:38pm On Aug 04, 2017 |
EUR/USD analysis for August 04, 2017 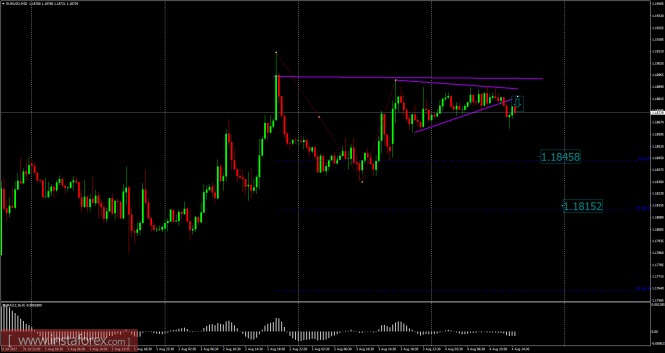 Recently, the EUR/USD has been trading sideways at the price of 1.1872. Anyway, according to the 30M time frame, I found a buying climatic action in the background and supply came in, which is a sign that buying looks risky. There is also a breakout of the symmetrical triangle, which is another sign of weakness. My advice is to watch for potential selling opportunities. The downward targets are set at the price of 1.1845 and 1.1815. Resistance levels: R1: 1.1900 R2: 1.1930 R3: 1.1965 Support levels: S1: 1.1835 S2: 1.1800 S3: 1.1770 Trading recommendations for today: watch for potential selling opportunities. Read more: https://www.instaforex.com/forex_analysis/96050 |
| Re: News And Technical Analysis From Instaforex by Instaforexbuk(f): 2:10pm On Aug 07, 2017 |
Wave analysis of the USD / CHF currency pair for August 7, 2017  Analysis of wave counting: In general, it is expected that during the Friday's trading, the pair USD / CHF was able to resume the development of the upward movement, adding about 90 pp in price and work out the mark of 0.9760 at the end of the day. It can be assumed that the currency pair still confirmed the transition to the stage of formation of the third wave, in the first, as part of the future C. If this is the case, the currency pair will continue to rise in the direction of the first settlement goal for this third wave, in the 1st and in C, located at the approach to the level of the 99th figure. Targets for an upward wave option: 0.9750 - 0.9800 0.9900 Goals for a downward wave option: 0.9555 - 127.2% by Fibonacci 0.9388 - 161.8% by Fibonacci General conclusions and trading recommendations: The wave E, B supposedly completed its construction. Now the construction of wave C has supposedly begun, and the construction of its internal wave 2 has been completed. Thus, it is now possible to continue increasing quotations within wave 3, C with targets located about 98 and 99 figures. Read more: https://www.instaforex.com/forex_analysis/187584 |
| Re: News And Technical Analysis From Instaforex by Instaforexbuk(f): 2:02pm On Aug 08, 2017 |
Technical analysis of USD/JPY for August 08, 2017 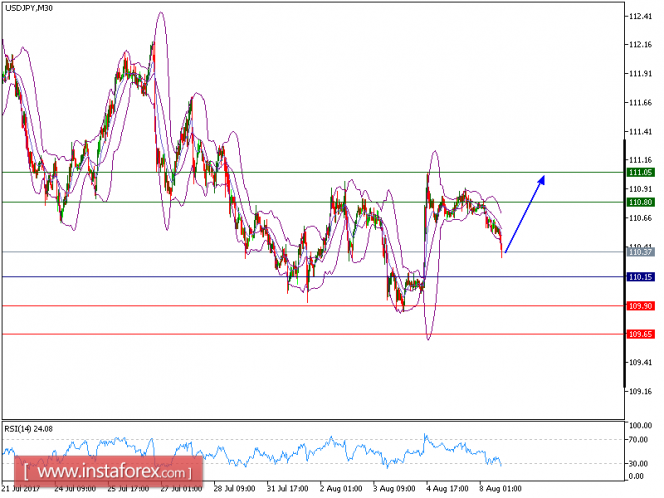 USD/JPY is expected to trade with bullish bias above 110.15. The pair is consolidating above the key support at 110.15, which should limit the downside potential. The relative strength index is above its neutrality level at 50 and lacks downward momentum. Therefore, as long as 110.15 is not broken, look for a further rise to 110.80 and even to 111.05 in extension. Alternatively, if the price moves in the opposite direction, a short position is recommended below 110.15 with a target at 109.15. Chart Explanation: The black line shows the pivot point. The current price above the pivot point indicates a bullish position while the price below the pivot point is a signal for a short position. The red lines show the support levels and the green line indicates the resistance level. These levels can be used to enter and exit trades. Strategy: BUY, Stop Loss: 110.15, Take Profit: 110.80 Resistance levels: 110.80, 111.05, and 111.40 Support Levels: 109.90, 109.65, 109.35 Read more: https://www.instaforex.com/forex_analysis/96245 |
| Re: News And Technical Analysis From Instaforex by Instaforexbuk(f): 3:39pm On Aug 09, 2017 |
Technical analysis of USD/CHF for August 09, 2017 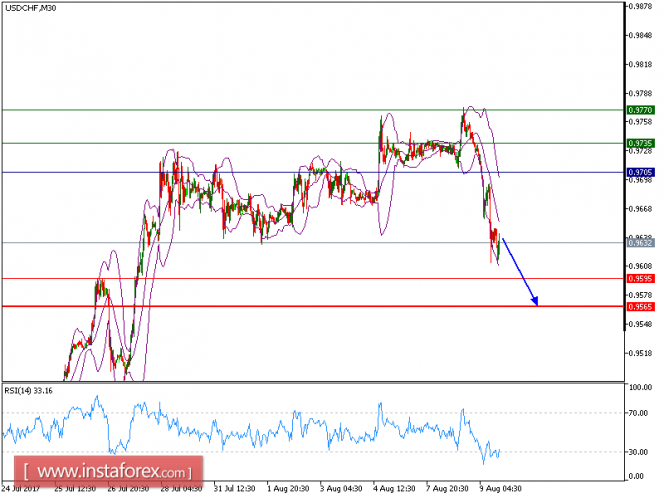 USD/CHF is under pressure and expected to trade in a lower range. The technical outlook of the pair is bearish as the price recorded lower tops and lower bottoms since August 3. The declining 50-period moving average is playing a resistance role. The relative strength index is below its neutrality level at 50. To conclude, as long as 0.9705 holds on the upside, a new drop to 0.9595 and even to 0.9565 seems more likely to occur. Chart Explanation: The black line shows the pivot point. The present price above the pivot point indicates the bullish position and below the pivot points indicates the short position. The red lines show the support levels and the green line indicates the resistance levels. These levels can be used to enter and exit trades. Strategy: SELL, Stop Loss: 0.9705, Take Profit: 0.9595 Resistance levels: 0.9735, 0.9770, and 0.9795 Support levels: 0.9695, 0.9565, and 0.9525 Read more: https://www.instaforex.com/forex_analysis/96361 |
| Re: News And Technical Analysis From Instaforex by Instaforexbuk(f): 11:10am On Aug 10, 2017 |
Wave analysis of the USD / CHF currency pair for August 10, 2017  Analysis of wave counting: Yesterday's USD / CHF trades started with a downward movement, losing more than 130 percentage points by the beginning of the European session and falling to the level of 0.9610. The wave situation formed in this case allows us to consider the maximum of the first wave as the vertex of the first wave, in the first wave, as part of the future C. If this is so, then before marking the beginning of the 3rd wave, in the 1st, in C, the currency pair can test the level of the 96th figure, or continue the decline of quotations to the level of 0.9570. Targets for the upward wave option: 0.9750 - 0.9800 0.9900 Goals for the downward wave option: 0.9609 - 50.0% by Fibonacci 0.9570 - 61.8% by Fibonacci General conclusions and trading recommendations: The wave E, B has completed its construction. Now the construction of the proposed wave C continues. Thus, now it is possible to resume the increase in quotations within the wave 3, 1, C with targets located about 98 and 99 figures. It is also possible to continue the decline in quotations within the correction wave 2, 1, C with targets located near the estimated levels of 0.9609 and 0.9570, which corresponds to 50.0% and 61.8% of Fibonacci, since the wave is still not quite complete. Read more: https://www.instaforex.com/forex_analysis/187844 |
| Re: News And Technical Analysis From Instaforex by Instaforexbuk(f): 3:52pm On Aug 11, 2017 |
Wave analysis of the USD / JPY currency pair for August 11, 2017  Analysis of wave counting: The geopolitical problems in the Far East rendered significant support to the yen, which allowed the pair USD / JPY to start yesterday's trading with a downward movement and finish the day with a fall to 109.10. At the same time, it can be assumed that the currency pair remained in the stage of formation of the 5th wave, in the 1st, C, E, (B), nearing its completion and making its wave structure even more complicated. If this is so, while maintaining the potential for reversal and completion of the entire 1st wave, C, E, (B) near the low of the past day, the currency pair may continue to decline quotations up to the level of 108.30. Targets for the downward wave option: 108.30 - 100.0% by Fibonacci Goals for the upward wave option: 109.79 - 61.8% by Fibonacci 111.00 - 112.00 General conclusions and trading recommendations: The instrument completed the construction of wave E, C, (B). Within the framework of the construction of wave 5, 1, C, E, (B), the reduction of quotes continues with the targets near the calculated mark of 108.30, which is equivalent to 100.0% of Fibonacci. After the completion of the construction of this wave, the quotations will begin to rise within the framework of the correctional 2, C, E, (B) with targets located about 111 and 112 figures. Read more: https://www.instaforex.com/forex_analysis/187944 |
| Re: News And Technical Analysis From Instaforex by steemlord: 8:45pm On Aug 11, 2017 |
Instaforexbuk: Does ur platform have currency index eg. Usdindex, jpyindex and cadindex? |
| Re: News And Technical Analysis From Instaforex by Instaforexbuk(f): 3:52pm On Aug 14, 2017 |
Positive expectations for the dollar EUR/USD, GBP/USD The past Friday closed with a slight increase in the euro and the pound due to the weaker than expected July inflation in the US. The consensus forecast for consumer prices implied an increase of 0.2% in both the basic CPI and the general CPI. However, for both indices, the growth was 0.1%. On an annual basis, the CPI rose from 1.6% to 1.7% with expectations at 1.8% . Meanwhile, the basic CPI remained at the expected 1.7% y / y. Also, the representatives of the Federal Reserve Bank R. Kaplan and N. Kashkari acted relatively gently about the prospects for monetary policy. They focused on the fresh report on consumer prices. The probability of a December rate increase in December fell to 35.4%. Investors are moving the next increase to March next year (52.7%). In spite of this, the markets will have enough as the Fed begins to wind down its balance sheet starting in September. By its action, this measure is similar to raising the rate. This is because it will put pressure on the yield of bonds and create a currency deficit. Truly, there is one trick here. If the Fed lowers the rate on excess reserves of banks, which now stands at 1.25%, the banks will withdraw these funds from the cache to the Fed and invest in commodity markets (and if everything is quiet, then the stock market). And then the commodity markets will drag the dollar down, as it was in 2007. On Wednesday, the minutes from the last meeting of the Fed will be published. The mood of the committee shows that it can already be written that it will start reducing the balance in September. This week, important macroeconomic data will come out. According to forecasts, the advantage may be on the side of the dollar. Tomorrow, there will be data on retail sales in the US for July with a 0.4% forecast and for base sales (excluding cars) a 0.3% forecast. For the euro, we are waiting for a decline to 1.1640. 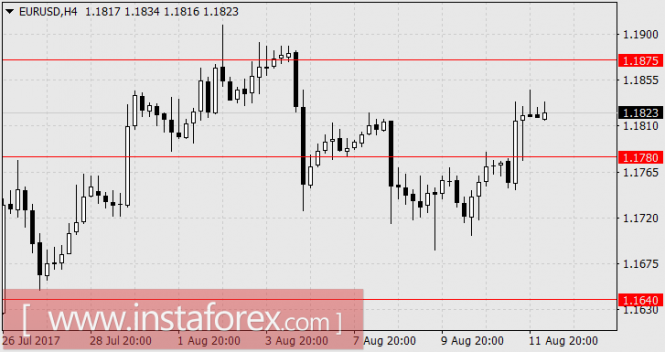 On the British pound, the upward correction may continue as the British CPI indicators for July are published with positive forecast. According to the basic CPI, the growth is from 2.4% y / y to 2.5% y / y. According to the general CPI, the growth is 2.7% y / y versus 2.6% y / y in June. We are waiting for growth in the range of 1.3095-1.3115. 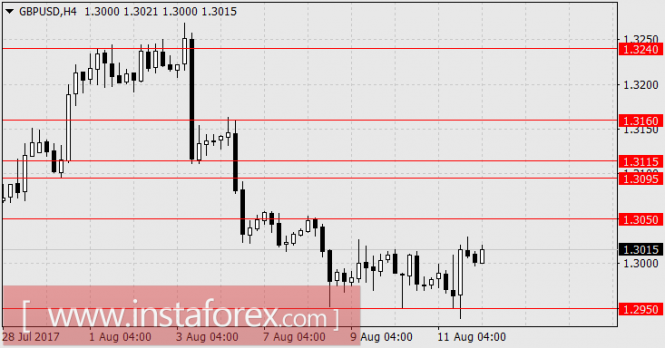 AUD / USD Last weekend, the mutual intimidation of North Korea and the United States was noticeably reduced. Market participants found this fact to be a return to initial positions. We agree with this assessment of the situation as the US is more concerned about the Chinese technological espionage. This will be the press conference of D. Trump today. It is possible that the US will impose sanctions on China or, more likely, increase import duties. Also, the US is interested in the pressure on the DPRK by China. With these sentiments, the stock indices of the ATR are growing today. The Australian dollar is adding 12 points, although not without a general weakening of the US dollar. However in China, apart from political blackmail, not everything is good, including their economic indicators. Data released today on industrial production for the July estimate showed a drop from 7.6% y / y to 6.4% y / y. The expectation was a slower decline to 7.2% y / y. Investments in fixed assets decreased from 8.6% y / y to 8.3% y / y. Retail sales in July decreased from 11.0% y / y to 10.4% y / y. Real estate sales decreased from 16.1% for the first half of last year to 14.0% for the same period of this year. All of this indicates a clear slowdown in China's economy and there were forecasts that GDP this year will not reach the expected 6.5% which has already been lowered from an earlier forecast of 6.7%. The cost of metal fittings fell on Friday by 2.7% with iron ore falling by 1.3%, to 72.81 dollars. Tomorrow, the protocol from the RBA meeting last August 1 will be published. It is expected to be have a moderately aggressive attitude towards the "high rate" of the Australian dollar. We are waiting for quotation in the range of 0.7710 / 30. 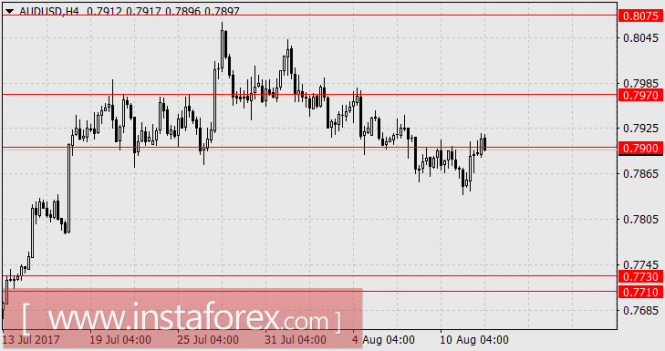 Read more: https://www.instaforex.com/forex_analysis/187978 |
| Re: News And Technical Analysis From Instaforex by Instaforexbuk(f): 1:47pm On Aug 15, 2017 |
Global macro overview for 15/08/2017 The Consumer Price Index data from the UK are scheduled for release at 08:30 am GMT and market participants expect no change in inflationary pressures on a monthly basis (0.0% vs. 0.0% prior) and a little change to the upside on a yearly basis ( 2.7% vs. 2.6% prior). After trending higher in last eight months, the inflation eased a little in June this year. Nevertheless, the overall trend still looks positive and still points to the upside. The recent CPI reading of 2.9% in May is higher than anticipated 2.7% figure, but a firmer number will refocus attention on this year's rebound in inflation. Moreover, it is worth to notice that a year ago, in August 2016, CPI posted a weak 0.6% rise. The key for a hotter inflation reading in the UK is in the food prices which came to a fairly abrupt end in the aftermath of the Brexit vote. The Bank of England recently increased the inflation target for this year up to the level of 3.0%, which is well above the 2.0% target from the beginning of the year. Nevertheless, it is still unclear whether the rising inflationary pressures will trigger the interest rate hike cycle due to the fact that the main reason for the recent jump in inflationary pressures is attributed to weaker currency levels after the last year's Brexit referendum vote. The pressure on the pound sterling is still high and any disappointing numbers from today's data might cause the pound sell-off across the board. Let's now take a look at the GBP/USD technical picture on the H4 time frame. The market is already trading close to the consolidation area at the technical support level of 1.2932, so worse than expected data might extend the move lower towards the next technical support at the level of 1.2861. The inability of the momentum indicator to move above the fifty level supports the short-term bearish bias. 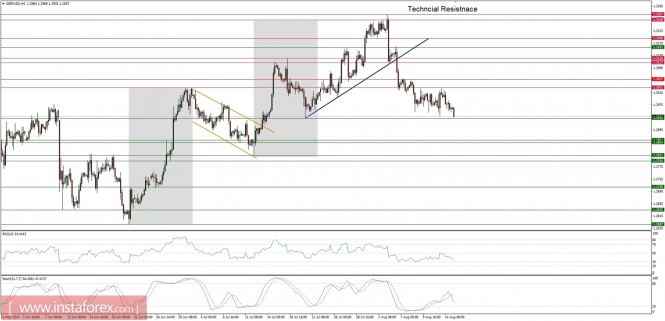 Read more: https://www.instaforex.com/forex_analysis/96692 |
| Re: News And Technical Analysis From Instaforex by Instaforexbuk(f): 3:40pm On Aug 16, 2017 |
[bWave analysis of the EUR / USD currency pair for August 16, 2017 [/b]  Analysis of wave counting: In general, it is expected that trading yesterday's EUR / USD pair will start with the continuation of the downward movement. After losing about 100 pips, it broke through the minimum level reached on August 8 at 1.1688. It can be assumed that the transition of the currency pair is confirmed the formation of the 3rd wave in (C). If this happens, there is a good prospect for currency pair to further lower the quotations in direction of the consolidation targets for the 3rd wave in (C), which is located up to the level of the 15th figure. Objectives for building a downward wave: 1.1625 - 100.0% Fibonacci retracement 1.1585 - 127.2% by Fibonacci Goals for building an upward wave: 1.1898 - 161.8% by Fibonacci 1,2000 General conclusions and trade recommendations: If the currency pair supposedly completed the wave (B) near the mark of 1.1898, it is now possible to continue the decrease of quotations as part of the future (C). The targets are located near the levels of 1.1625 and 1.1585 corresponding to 100.0% and 127.2% of Fibonacci. Most likely, the correction of wave 2 has already completed its construction. Read more: https://www.instaforex.com/forex_analysis/188203 |
| Re: News And Technical Analysis From Instaforex by Instaforexbuk(f): 9:55am On Aug 17, 2017 |
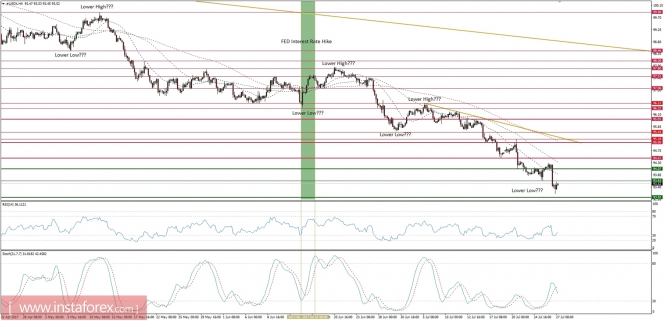
AUD/JPY testing major resistance, remain bearish The price is testing major resistance at 87.39 (Fibonacci retracement, horizontal overlap resistance, Fibonacci extension) and we expect to see a reaction from this level for a drop to at least 86.32 support (Fibonacci retracement, horizontal swing low support). Stochastic (34,5,3) is seeing major resistance below 96% where we expect to see a corresponding reaction in price from. Correlation analysis: We're seeing JPY strength with drops on AUD/JPY, EUR/JPY, and USD/JPY. Sell below 87.39. Stop loss is at 88.08. Take profit is at 86.32. Read more: https://www.instaforex.com/forex_analysis/96843 |
| Re: News And Technical Analysis From Instaforex by Instaforexbuk(f): 4:24pm On Aug 18, 2017 |
Wave analysis of the GBP / USD currency pair for August 18, 2017  Analysis of wave counting: Having failed to determine the direction of the movement, yesterday's GBP / USD traded within a narrow range, with a maximum amplitude of price changes of just over 50 pp. At the same time, it can be assumed that the currency pair still remained in the formation stage of a rather complex waveform c, as part of a downward correcting structure, starting from the maximum on August 3. If this is the case, the currency pair retained the potential, allowing it to resume the decline of quotations to the level of 1.2790 or even to the level of 1.2700. The objectives for building the downward wave: 1.2835 - 61.8% by Fibonacci 1.2789 - 76.4% by Fibonacci Goals for the construction of the upward wave: 1.3000 - 1.3100 General conclusions and trading recommendations: The British currency has completed the construction of the wave 3 or C of the upward trend section. In this case, the internal wave structure of this wave may require the introduction of adjustments and significantly more complicated. The decline in quotes may continue with targets near the estimated levels of 1.2835 and 1.2789, which corresponds to 61.8% and 76.4% of Fibonacci, within the limits of the supposedly 3-wave downward structure. Read more: https://www.instaforex.com/forex_analysis/188357 |
| Re: News And Technical Analysis From Instaforex by Instaforexbuk(f): 3:38pm On Aug 21, 2017 |
Global macro overview for 21/08/2017 The focal point on the economic calendar will be the Jackson Hole symposium at the end of the week, while the U.S. politics and geopolitical factors may become sidebars. The main theme of the speech will be the stability of the financial system. Among the speakers there will be US Fed Chairperson Janet Yellen and ECB President Mario Draghi. Groundbreaking declarations are unlikely, but investors will carefully analyze the smallest suggestions on the future of major central banks' monetary policy. It is worth to mention last week's speech of Fed Vice President William Dudley which was less dovish than the content of the July FOMC minutes. Dudley and Yellen were often very consistent in assessing the processes in the economy and the optimum shape of politics. Both of them also represent the "center of gravity" of the Fed views. Therefore, Yellen's speech may be a stepping stone to the belief that, despite mixed data from recent weeks, the Federal Reserve remains on the path of gradual normalization. Key will be the interpretation of pricing processes in the US and assessment of the sustainability of inflation slowdown. Any mention of growing imbalances, overly high valuations of assets or under tight financial conditions should be interpreted as a hawkish signal in anticipation of another rate hike. Global investors are still underestimating the possibility of the Fed hiking the interest rate more often than quarterly and the current anticipation of another interest rate hike in December is quite low (40% implied probability of a rate hike to 1.5% according to CME FedWatch Tool). Almost the same anticipation level is currently set on March 2018: only 43% chances for a hike to 1.5%. This figures can quickly change if Yellen gives any hawkish clues in Jackson Hole. Let's now take a look at the US Dollar Index technical picture at the H4 time frame. The market is moving inside of a blue channel and bulls are unable to break out above the golden trend line resistance around the level of 94.11. The market is in the critical moment and a breakout in either direction is expected. 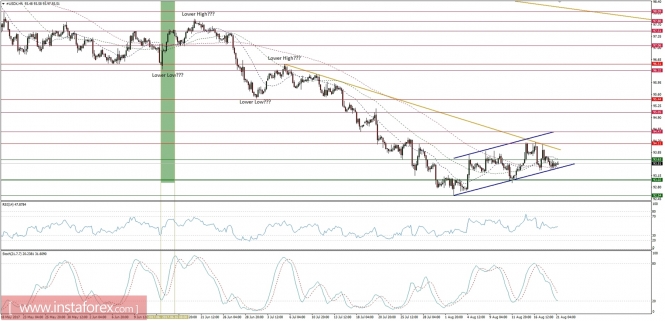 Read more: https://www.instaforex.com/forex_analysis/97057 |
| Re: News And Technical Analysis From Instaforex by Instaforexbuk(f): 2:40pm On Aug 22, 2017 |
Technical analysis of USD/JPY for Aug 22, 2017 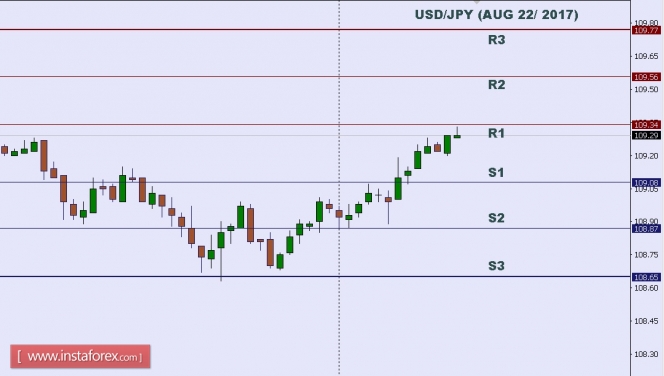 In Asia, Japan today will not release any important economic data but the US will unveil some key news such as the Richmond Manufacturing Index, HPI m/m. So there is a probability that USD/JPY will move with low to medium volatility during this day. TODAY'S TECHNICAL LEVELS: Resistance. 3: 109.77. Resistance. 2: 109.56. Resistance. 1: 109.34. Support. 1: 109.08. Support. 2: 108.87. Support. 3: 108.65. Disclaimer: Trading Forex (foreign exchange) on margin carries a high level of risk, and may not be suitable for all investors. The high degree of leverage can work against you as well as for you. Before deciding to invest in foreign exchange you should carefully consider your investment objectives, level of experience, and risk appetite. The possibility exists that you could sustain a loss of some or all of your initial investment and therefore you should not invest money that you cannot afford to lose. You should be aware of all the risks associated with foreign exchange trading, and seek advice from an independent financial advisor if you have any doubts. Read more: https://www.instaforex.com/forex_analysis/97135 |
| Re: News And Technical Analysis From Instaforex by Instaforexbuk(f): 4:00pm On Aug 23, 2017 |
Technical analysis of USD/CHF for August 23, 2017 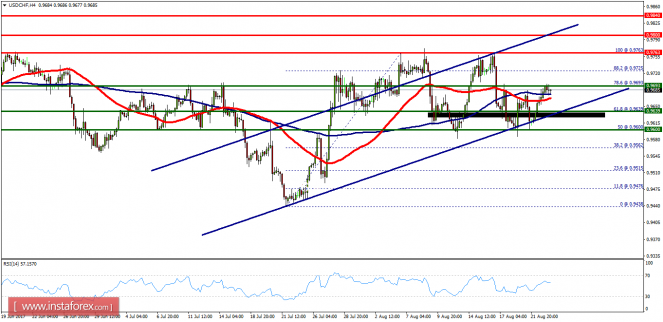 Overview: The USD/CHF pair is still moving upwards from 0.9639. The bias remains bullish in the nearest term testing 0.9763 or 0.9800. The market has been trading around the area of 0.9639. The pair rose from the levels of 0.9639 and 0.9600 (these levels coincide with the ratios of 61.8% Fibonacci retracement and 50%) to a top around 0.9733. The first support level is seen at 0.9639 followed by 0.9600, while daily resistance 1 is seen at 0.9763. The USD/CHF pair is still moving between the levels of 0.9693 and 0.9763 in coming hours. On the one-hour chart, the immediate resistance is seen at 0.9763 which coincides with the double top. Currently, the price is moving in a bullish channel. This is confirmed by the RSI indicator signaling that we are still in a bullish trending market. The price is still above the moving average (100). Therefore, if the trend is able to break through the first resistance level of 0.9763, we should see the pair climbing towards the second daily resistance at 0.9800 to test it. However, it would also be wise to consider where to place stop loss; this should be set below the last support 0.9600. The trend is still calling for a strong bullish market as long as the trend is still above the level of 0.9639. Read more: https://www.instaforex.com/forex_analysis/97261 |
| Re: News And Technical Analysis From Instaforex by Instaforexbuk(f): 1:38pm On Aug 24, 2017 |
Technical analysis of USD/CHF for August 24, 2017 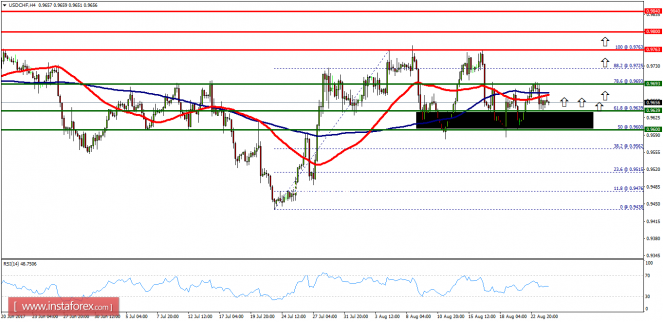 Overview: The USD/CHF pair is still trading upwards from 0.9639. The bias remains bullish in the nearest term testing 0.9763 or 0.9800. The market has been trading around the area of 0.9639. The pair rose from the levels of 0.9639 and 0.9600 (these levels coincide with the ratios of 61.8% Fibonacci retracement and 50%) to a top around 0.9733. The first support level is seen at 0.9639 followed by 0.9600, while daily resistance 1 is seen at 0.9763. The USD/CHF pair is still moving between the levels of 0.9693 and 0.9763 in coming hours. On the one-hour chart, the immediate resistance is seen at 0.9763 which coincides with the double top. Currently, the price is moving in a bullish channel. This is confirmed by the RSI indicator signaling that we are still in a bullish trending market. The price is still above the moving average (100). Therefore, if the trend is able to break through the first resistance level of 0.9763, we should see the pair climbing towards the second daily resistance at 0.9800 to test it. However, it would also be wise to consider where to place stop loss; this should be set below the last support 0.9600. The trend is still calling for a strong bullish market as long as the trend is still above the level of 0.9639. Read more: https://www.instaforex.com/forex_analysis/97339 |
| Re: News And Technical Analysis From Instaforex by Instaforexbuk(f): 10:24am On Aug 25, 2017 |
Global macro overview for 25/08/2017 Other signs of inflationary pressures were revealed in the recent data. Japanese National CPI data were released at the level of 0.4%, unchanged from a month ago, but CPI minus fresh food – a key proxy for core inflation – increased from 0.4% to 0.5% in the reported month. The reading matched a median estimate of economists and marked the seventh consecutive monthly increase for the core price index. The biggest jump in inflation was noted in Tokyo, where core inflation, a leading measure of nationwide price trends, climbed 0.4%. Core prices in the capital city climbed 0.2% in June. Despite the fact that the inflationary pressures in Japan are increasing, the inflation is still well below the Bank of Japan official target of 2.0%. According to the latest BoJ statements, as long as the target is not achieved, the BoJ monetary policy will remain highly accommodative (monetary easing will remain the norm for the foreseeable future). This decision was made even after the good data from the Japanese economy had been delivered throughout the whole 2017 ( better than expected GDP, low unemployment, etc ). Japan's run of six straight quarters of growth marks the longest expansion since 2006. Let's now take a look at the USD/JPY technical picture at the H4 time frame. After rejection at the level of 111.00, the market slid towards the technical support at the level of 108.79 and tested it three times already. Nevertheless, no new lower close was made and so far the market is trading in a narrow range between the levels of 109.84 - 108.59. 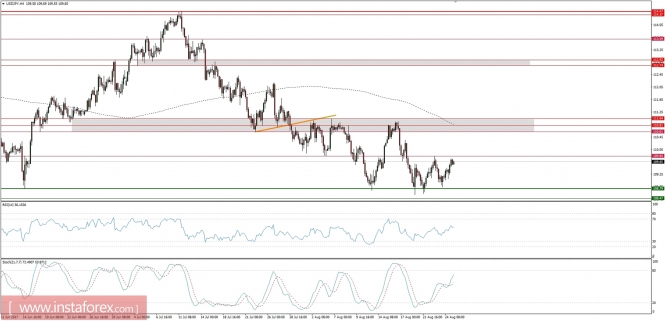 Read more: https://www.instaforex.com/forex_analysis/97460 |
| Re: News And Technical Analysis From Instaforex by Instaforexbuk(f): 9:03am On Aug 28, 2017 |
Technical analysis of USD/JPY for Aug 28, 2017 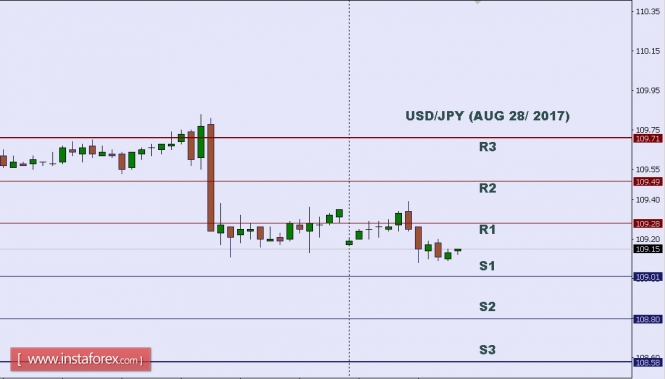 In Asia, today Japan will not release any Economic Data, but the US will release some Economic Data, such as Prelim Wholesale Inventories m/m and Goods Trade Balance. So, there is a probability the USD/JPY will move with low to medium volatility during this day. TODAY'S TECHNICAL LEVEL: Resistance. 3: 109.71. Resistance. 2: 109.49. Resistance. 1: 109.28. Support. 1: 109.5201. Support. 2: 108.80. Support. 3: 108.58. Disclaimer: Trading Forex (foreign exchange) on margin carries a high level of risk, and may not be suitable for all investors. The high degree of leverage can work against you as well as for you. Before deciding to invest in foreign exchange you should carefully consider your investment objectives, level of experience, and risk appetite. The possibility exists that you could sustain a loss of some or all of your initial investment and therefore you should not invest money that you cannot afford to lose. You should be aware of all the risks associated with foreign exchange trading, and seek advice from an independent financial advisor if you have any doubts. Read more: https://www.instaforex.com/forex_analysis/97521 |
| Re: News And Technical Analysis From Instaforex by Instaforexbuk(f): 12:36pm On Aug 29, 2017 |
Technical analysis of USD/CHF for August 29, 2017 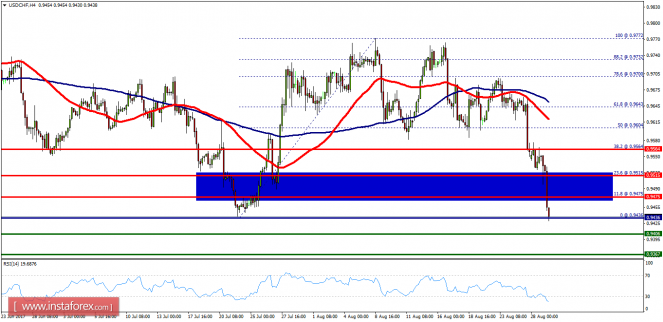 Overview: The USD/CHF pair has faced strong resistances at the levels of 0.9475 because support had become resistance on August 29, 2017. So, the strong resistance has been already formed at the level of 0.9475 and the pair is likely to try to approach it in order to test it again. However, if the pair fails to pass through the level of 0.9475, the market will indicate a bearish opportunity below the new strong resistance level of 0.9475. Moreover, the RSI starts signaling a downward trend, as the trend is still showing strength above the moving average (100) and (50). Thus, the market is indicating a bearish opportunity below the area of 0.9475/0.9500 so it will be good to sell at 0.9475 with the first target of 0.9406. It will also call for a downtrend in order to continue towards 0.9367. The daily strong support is seen at 0.9367. However, the stop loss should always be taken into account, for that it will be reasonable to set your stop loss at the level of 0.9515. Read more: https://www.instaforex.com/forex_analysis/97679 |
| Re: News And Technical Analysis From Instaforex by Instaforexbuk(f): 1:47pm On Aug 30, 2017 |
Technical analysis of NZD/USD for August 30, 2017 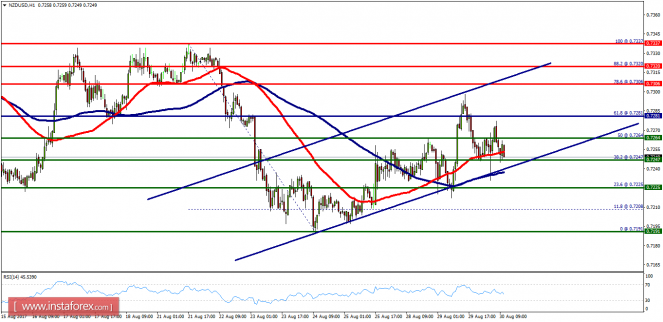 Overview: The NZD/USD pair bullish trend from the support levels of 0.7264 and 0.7247. Currently, the price is in a bullish channel. This is confirmed by the RSI indicator signaling that we are still in a bullish trending market. As the price is still above the moving average (100), immediate support is seen at 0.7264, which coincides with a golden ratio (50% of Fibonacci). Consequently, the first support is set at the level of 0.7264. So, the market is likely to show signs of a bullish trend around the spot of 0.7264/0.7247. Hence, buy above the levels of 0.7264/0.7247 with the first target at 0.7306 in order to test the daily resistance 1 and further to 0.7320. Also, it might be noted that the level of 0.7337 is a good place to take profit because it will form a double top. On the other hand, in case a reversal takes place and the NZD/USD pair breaks through the support level of 0.6274, a further decline to 0.7200 can occur which would indicate a bearish market. Overall, we still prefer the bullish scenario, which suggests that the pair will stay above the zone of 0.7247/0.7225 today. Read more: https://www.instaforex.com/forex_analysis/97778 |
| Re: News And Technical Analysis From Instaforex by Instaforexbuk(f): 1:50pm On Aug 31, 2017 |
USD/JPY analysis for August 31, 2017 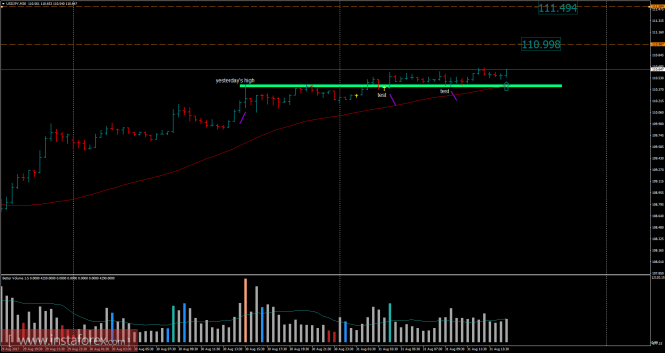 Recently, the USD/JPY pair has been upwards. The price tested the level of 110.65 in a high volume. According to the 30M time frame, I found successful testing of support in a low volume, which is a sign that buyers are in control. My advice is to watch for potential buying opportunities. The upward targets are set at the price of 111.00 and 111.50. The daily trend is bullish. Resistance levels: R1: 110.60 R2: 111.00 R3: 111.50 Support levels: S1: 109.70 S2: 109.15 S3: 108.80 Trading recommendations for today: watch for potential buying opportunities. Read more: https://www.instaforex.com/forex_analysis/97894 |
| Re: News And Technical Analysis From Instaforex by Instaforexbuk(f): 10:45am On Dec 11, 2017 |
Wave analysis of the USD/CHF currency pair for December 11, 2017  Analysis of wave counting: Friday's trading started with the upward movement, however, the USD/CHF pair, could not gain a foothold above 0.9975 and before the end of trading rolled back more than 50 percentage points from the high reached in the middle of the day. At the same time, it can be assumed that, while remaining in the stage of formation of the wave c, in a, in C, the currency pair completed its internal 3rd wave and already designated the 4th wave. If this is the case, then the attempt to test the level of the 99th figure can lead to the resumption of the growth of quotations in the direction of targets for this wave c, in a, in C, located above the level of price parity. At the same time, the probability of continuation of the beginning of the downward movement to the level of 0.9655 and the significant complication of the internal wave structure of wave b, in a, in C, continues to remain relevant. Targets for an upward wave option: 1.0004 - 127.2% by Fibonacci 1.0050 - 161.8% by Fibonacci Targets for a downlink wave option: 0.9728 - 50.0% by Fibonacci General conclusions and trading recommendations: The currency pair continues to build an upward set of waves. The assumed wave b, in a, in C has completed its construction near the mark of 0.9728, which corresponds to 50.0% of Fibonacci. If this is the case, an extended increase in quotations is now expected with targets near the estimated levels of 1.0004 and 1.0050, which corresponds to 127.2% and 161.8% of Fibonacci retracement (these targets will be reviewed). Read more: https://www.instaforex.com/forex_analysis/195559 |
| Re: News And Technical Analysis From Instaforex by Instaforexbuk(f): 11:07am On Dec 12, 2017 |
Fundamental Analysis of GBP/USD for December 12, 2017 GBP/USD is currently quite bearish in nature having strong rejection of the bulls yesterday by bouncing off the weekend gap created in the market. This week, both central banks in the UK and the US are holding policy meetings. The US Fed is widely expected to increase its funds rate to 1.50% from the previous value of 1.25%. Next day, the Bnak of England is going to announce its policy decision, so the key interest rate is expected to remain unchanged at 0.50%. By the end of this week, a good amount of volatility is expected along with a directional bias of the market. This should be analized to track the upcoming direction in this pair. Today, the UK CPI report is going to be published which is expected to be unchanged at 3.0%, PPI Input report is expected to increase to 1.6% from the previous value of 1.0%, RPI report is expected to show a slight increase to 4.1% from the previous value of 4.0%, Core CPI is expected to be unchanged at 2.7%, HPI report is expected to decrease to 5.2% from the previous value of 5.4%, and PPI Output is expected to be unchanged at 0.2%. On the USD side, today the US PPI report is going to be published which is expected to be unchanged at 0.4%, Core PPI report is expected to decrease to 0.2% from the previous value of 0.4%, and NFIB Small Business Index report is expected to increase to 104.6 from the previous figure of 103.8. As for the current scenario, the pair is already quite volatile but with the upcoming high impact economic events and reports, the pair is expected to get a directional bias which is most likely to be on the USD side, taking the price much lower in the coming days. Now let us look at the technical chart. The price is currently showing some bearish pressure off the dynamic level of 20 EMA above the support area of 1.33. The price is expected to break below 1.33 to reach the lower support area of 1.31 area in the coming days. The rate rike decision on Wednesday opens doors for the USD to gain more momentum. As the price remains below 1.35, the bearish bias is expected to continue further. 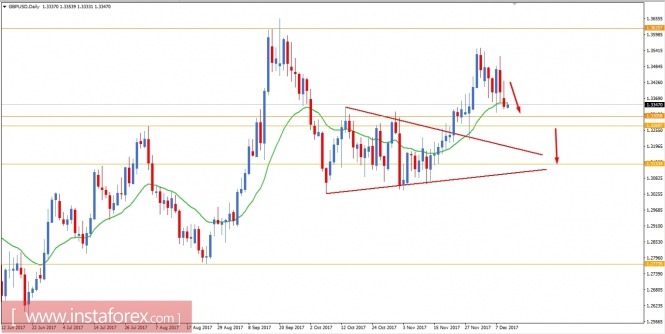 Read more: https://www.instaforex.com/forex_analysis/105284 |
(1) (2) (3) ... (6) (7) (8) (9) (10) (11) (12) ... (23) (Reply)
ICPC Arrests Osun FCMB Manager Over New Naira Notes Policy Violation / Kwik Cash Borrowing / Naira Depreciates To ₦410 Per Dollar As Local Currency Weakens
(Go Up)
| Sections: politics (1) business autos (1) jobs (1) career education (1) romance computers phones travel sports fashion health religion celebs tv-movies music-radio literature webmasters programming techmarket Links: (1) (2) (3) (4) (5) (6) (7) (8) (9) (10) Nairaland - Copyright © 2005 - 2024 Oluwaseun Osewa. All rights reserved. See How To Advertise. 180 |