Can Rooftop Solar Be Cheaper Than The Conventional Grid Energy? - Politics - Nairaland
Nairaland Forum / Nairaland / General / Politics / Can Rooftop Solar Be Cheaper Than The Conventional Grid Energy? (838 Views)
National Grid Collapses, Generation Drops To 92MW / Federal Ministry Of Power's Statement On The Blackout On The National Grid. / Blackout: Nigeria’s National Grid Collapses (2) (3) (4)
(1) (Reply)
| Can Rooftop Solar Be Cheaper Than The Conventional Grid Energy? by Standing5(m): 1:22am On Mar 09, 2017 |
By Joshua D. Rhodes The National Renewable Energy Laboratory this week said that rooftop solar panels have the potential to generate nearly 40 percent of electricity in the U.S. But what about the cost of going solar? Many people ask when the cost of producing power from solar photovoltaic (PV) panels will be equal to or less than buying from the grid – a point called “grid parity” that could accelerate solar adoption. But in asking the question, they often compare apples to oranges and forget that the answer varies from place to place and from one type of installation to another. For example, electricity from utility-scale solar systems (typically large arrays where panels slowly change tilt and orientation to face the sun all day) usually costs less than electricity produced from solar panels fixed on someone’s home. Also, residential electric rates, on average about 12 cents per kilowatt-hour in in the U.S., are much higher than wholesale electric rates – the price utilities pay to power generators – which are usually less than 4 cents per kilowatt-hour. At the same time, different states have more or less sun – solar power in Florida is typically more economic than in Alaska, for instance. All of these factors make the question more complicated than people might anticipate. How, then, can we compare the cost of rooftop solar to the cost of buying power from the local electricity grid and thereby find when which states will hit the point of grid parity? Putting a Number on Solar Cost The levelized, or average, cost of electricity from a solar PV array is derived from all the money spent to buy, install, finance and maintain the system divided by the total amount of electricity that system is expected to produce over its lifetime. We call this value the Levelized Cost of Electricity (LCOE) and it’s expressed in terms of dollars per kilowatt-hour ($/kWh). The same metric can be used to determine the cost for a coal or natural gas plant. Planners like it because it reduces the cost of a power plant over a span of many decades into a single number. Despite the strengths of LCOE as a metric – it is easy to understand and widely used – it has some shortcomings, too. Namely, it leaves out geographic variability, changes with seasons and usually ignores the cost of environmental impacts such as the cost of carbon emissions. This metric is a bit too simple when comparing variable wind and solar generators to power plants that you can turn on and off at will, such as those fueled by uranium, coal and natural gas. Today the average cost of energy from solar PV in U.S. is reported to be 12.2 cents per kWh, which is about the same as the average retail rate. Those who keep close tabs on electricity prices might think that it is about on par with what they are paying for their own electricity at home. This number can be misleading, however, because it represents the average price of utility-scale solar across the U.S., not necessarily the cost borne to produce electricity from solar panels on our homes. So how do we know how close residential solar is to grid parity where you live? Ultimately, that depends on two things: how much you pay for the electricity you buy from the local grid, and how much can you get paid for the electricity you can produce from PV. Let’s take a look at both of them. How Much Sun Do You Get? The Energy Information Agency (EIA) has created a map of average electricity rates by zip code, averaged to the county level and remade by the author in the map below. The deep red (or darker) colors indicate higher average residential electricity rates. [img]https://www.usnews.com/dims4/USNEWS/4b330d8/2147483647/resize/970x/quality/85/?url=%2Fcmsmedia%2F28%2Feb%2Fe5eed0e84a119511e7d42fec0265%2F160331-electricity2-graphic.png[/img] Read the rest here |
| Re: Can Rooftop Solar Be Cheaper Than The Conventional Grid Energy? by Standing5(m): 1:25am On Mar 09, 2017 |
What Does Regular Electricity Cost? Avg. US Electricity Prices - 2015 Residential 12.67¢/Kwh Commercial 10.59¢/Kwh Industrial 6.89¢/Kwh 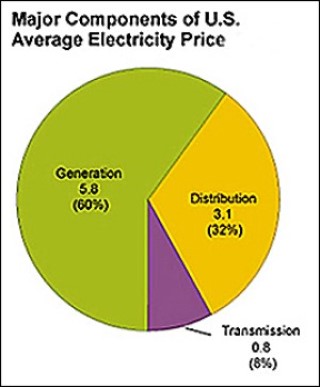 The chart at the left shows the yearly average cost of electricity for 2015 by consumer group per the EIA (the US Energy Information Administration). For 2015 the average residential cost was 12.67 cents per kilo-watt hour up 1.2% from 2014. Commercial was 10.59 cents and industrial 6.89 cents, down 1.4% and 3.0% respectively year over year. Residential prices in the US have risen by 3.0% per year over the past 10 years. The pie chart, below left, shows the make up of the overall US electricity price. Cost Make Up Regular Electricity Electricity prices vary by location due to type of power plants, cost of fuels, fuel transportation costs and state pricing regulations. The states with the highest average residential price of electricity in 2015 were: Hawaii (27.16¢ per kWh) Alaska (20.28¢ per kWh) Connecticut (20.01¢ per kWh) Those with the lowest average prices in 2015 were: Louisiana (9.05¢ per kWh) North Dakota (9.31¢ per kWh) Washington (9.37¢ per kWh) 2015 residential electricity prices were highest in Hawaii, 27.16¢ per kilo-watt hour (kWh), because most of their electricity is generated using crude oil.. The lowest price was in the state of Washington with 9.37¢ per kWh. In 2014 the US average residential household used 911 kWh per month and the average monthly electricity bill was $114 before taxes and fees. Prices are higher for residential and commercial customers than industrial customers because it costs more to distribute the electricity and step the voltages down. Industrial customers use more and can take their electricity at higher voltages so it does not need to be stepped down. These factors make the price of power to industrial customers close to the wholesale price of electricity (the price from one utility to another). Top |
| Re: Can Rooftop Solar Be Cheaper Than The Conventional Grid Energy? by Standing5(m): 1:38am On Mar 09, 2017 |
December 25th, 2016 by Zachary Shahan We already published a great article from Nexus Media regarding Lazard’s new report showing the extremely low (and falling) costs of solar power and wind power. However, I’ve been wanting to highlight these awesome new findings since Larmion shared the updated report with us earlier this month, and I want to break out the amazing news in 5 specific ways. These are 5 messages that I think anyone wanting a better US economy (or a better economy in practically any country), anyone wanting national energy freedom (aka energy independence), anyone wanting to advance the most cost-effective choices for electricity generation, and anyone wanting to make logical energy decisions should know and share with others. 1. Wind & Solar Are Cheaper (Without Subsidies) Than Dirty Energy The first point is the very basic fact that new wind power and/or solar power plants are typically cheaper than new coal, natural gas, or nuclear power plants — even without any governmental support for solar or wind. Not only are they typically cheaper — they’re much cheaper in many cases. Yes, these are levelized cost of energy (LCOE) estimates from Lazard based on various assumptions, and they are averages for the US as a whole rather than prices for specific locations within the US, but the lower estimated costs for these renewables are reflected in the real world as well, where solar & wind accounted for 69% of new capacity additions in 2015, 99% of new capacity additions in Q1 2016, a large portion of new capacity additions in Q2 2016, and probably ~⅔ of new capacity additions for 2016 as a whole. But these estimates in the charts above are actually unbalanced in favor of fossil fuels! Some of the assumptions are quite conservative, and some very real costs are left out. 2. Wind & Solar Are Actually Even Much Cheaper Than Dirty Energy (More So Than Lazard Shows) The estimates above are supposedly “unsubsidized,” but if you include social externalities as societal subsidies (I do), the estimated costs of fossil fuels and nuclear energy are hugely subsidized in those charts. A study led by the former head of the Harvard Medical School found that coal cost the US $500 billion per year in extra health and environmental costs — approximately 9¢/kWh ($90/MWh) to 27¢/kWh ($270/MWh) more than the price we pay directly. To fool yourself into thinking these are not real costs is to assume that cancer, heart disease, asthma, and early death are not real. The air, water, and climate effects of natural gas are not pretty either. On the nuclear front, the decommissioning and insurance costs of nuclear power — unaccounted for above — would also put nuclear off the chart. On the renewable front, costs to overcome intermittency of renewable energy sources (basically, presuming a very high penetration of renewables on the grid) are also not included. Once that is a significant issue (at which point solar and wind will be even cheaper), low-cost demand response solutions, greater grid integration, and storage will be key solutions to integrating these lower-cost renewable sources to a high degree. Back to Lazard’s assumptions, note that the IGCC and coal cost estimates do not include the costs of transportation and storage. Given these assumptions unrealistically favoring fossil fuels and nuclear energy, including subsidies for solar and wind is actually an even better way to look at costs of these electricity options. However, if you included historical subsidies as well — coal, natural gas, and nuclear have received a ton (well, many, many tons of subsidies) — dirty energy options would again look worse. In any case, here’s Lazard’s cost comparisons with current subsidies: 3. Solar & Wind Became Much Cheaper In The Past 7 Years (85% and 66%, Respectively) No, wind and solar costs didn’t roll off a cliff because of Obama, but his staff did help to hasten the roll to some degree. Programs like SunShot have helped to bring down costs even faster than they were coming down anyway, as did greater deployment of renewables — with greater production and deployment, costs come down almost automatically. A few years ago, I wrote that the cost of solar was probably “2–100 times cheaper than you think” — the point was that the cost of solar had come down very fast and if people had a cost of solar in their head from a few years before (or, let’s hope not, decades before), their cost assumption was wildly too high. As the charts above show, the costs of utility-scale solar power and wind power fell 85% and 66%, respectively, in the past 7 years. If you are working on cost assumptions from before President Obama took office, your assumed cost of solar or wind is wildly too high. If you talk to someone who thinks solar power and/or wind power is expensive, perhaps this is the simple problem — point them in the direction of this piece. 4. The Lowest Solar Costs Shown In The Lazard Report Are Considerably Higher Than Globally Recorded Low-Price Bids I won’t go into much detail right now, but I will update this article as more record-low prices for solar power and wind power are reported. For now, though, note that we’ve seen solar project bids for under 3¢/kWh in the UAE and well under 4¢/kWh in Mexico — prices that are well below the Lazard’s low-end estimates for the US.  Note that several of the prices in the chart above were the record-low globally for the world (as far as publicly revealed prices go) when they were made — including the first few and the last two. In just a few years’ time, the low-price records have fallen at a dramatic clip. 5. People Can Get Lower Prices But More Jobs With Solar & Wind |
(1) (Reply)
EFCC Planned To Pocket $5m Ikoyi Money / Dr. Habibat Lawan And Amb. Arab Yadam Take Over As Acting SGF And DG NIA / How Come Nigerian Citizens Can't Tour Aso Rock Like The White House?
(Go Up)
| Sections: politics (1) business autos (1) jobs (1) career education (1) romance computers phones travel sports fashion health religion celebs tv-movies music-radio literature webmasters programming techmarket Links: (1) (2) (3) (4) (5) (6) (7) (8) (9) (10) Nairaland - Copyright © 2005 - 2024 Oluwaseun Osewa. All rights reserved. See How To Advertise. 36 |