Instaforexbuk's Posts
Nairaland Forum › Instaforexbuk's Profile › Instaforexbuk's Posts
1 2 3 4 5 6 7 8 ... 10 11 12 13 14 15 16 17 18 (of 19 pages)
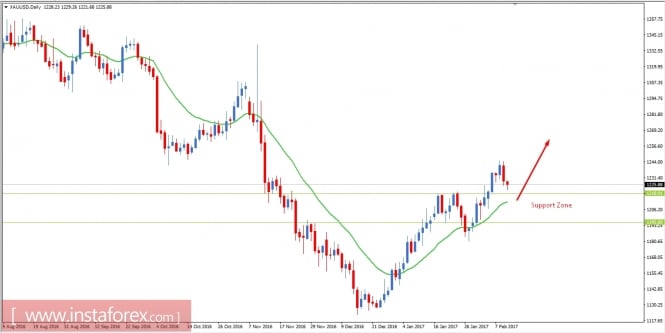
GOLD Fundamental Analysis February 10, 2017 GOLD continued it bullish counter move from the late December 2016, and continuing the bullish trend in non-volatile manner after massive sell off in 2016. Yesterday, USD had some pressure after the Unemployment claims positive report which resulted the price to proceeding down toward 1,218.91. In few weeks, Trump will be revealing the tax plan where the increase in tax on assets may result to fall in GOLD again. As there is no hint of increase of rate hike in USD as of Federal Reserve President Charles Evans speech, so far it is expected that without any intervention from Trump with his new plans on assets like GOLD, GOLD is expected to show some bullish momentum against the USD. Now let us look at the technical view, currently, market is trying to retest the support zone between 1195.80 to 1218.91. If the price rejects the bears in this support zone with any daily candle we will be looking forward to buy with a target toward 1,245 as first target and 1,299 as second target for the bullish move. On the other hand, if the price breaks and closes below the lower boundary of support zone i.e. 1,195.80, the bullish bias will be changed to bearish and we will target 1,118 as the downward target in this pair. https://forex-images.instaforex.com/userfiles/20170210/analytics589db7b108353.jpg Read more: https://www.instaforex.com/forex_analysis/87926 |
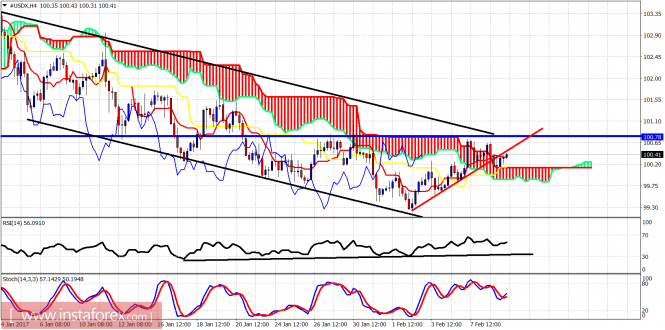
Wave analysis of USDX for February 9, 2017 The Dollar index is testing important short-term resistance as we mentioned yesterday. The price is showing signs of rejection. The 100.80 level is a key resistance, while a break below 100 will be the confirmation I need for my bearish short-term view for a new low around 99. https://forex-images.instaforex.com/userfiles/20170209/analytics589c211ca48c2.png Black lines - bearish channel Blue line - horizontal resistance Red line - short-term trendline support The Dollar index is trading above the Ichimoku cloud. The price has broken the short-term trendline support and now comes back to test it. The short-term support is at 100 and resistance is at 100.80. I continue to expect the price to make a new low towards 99 or lower. https://forex-images.instaforex.com/userfiles/20170209/analytics589c21899328d.png Green line - trendline support Blue line - projection forward My preferred scenario so far has been that we are making wave 4 down and we should soon see a reversal as a part of wave 5. The short-term trend remains bearish and if the price overlaps the wave 1 high, this scenario will be canceled and a more bearish view will be adopted. Either way a bounce is justified for USD from current or lower levels. Critical support for the longer-term bullish view remains the green upward sloping trendline. Read more: https://www.instaforex.com/forex_analysis/87842 |
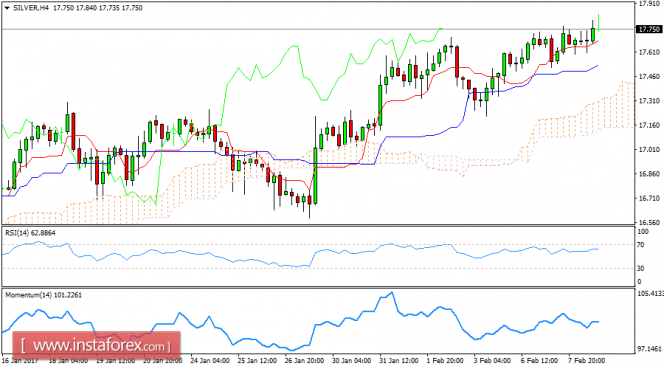
Daily analysis of silver for February 08, 2017 https://forex-images.instaforex.com/userfiles/20170208/SILVERH4.png Overview Silver price shows calm bullish bias in attempt to resume the short-term bullish trend. The price is supported by the EMA50, waiting for a rally towards 18.30 as the first target. Stochastic's negativity explains the reasons for the recent sideways fluctuation. Silver needs to gain enough positive momentum to continue the main bullish trend. In general, we will stick to the bullish scenario in the upcoming period unless the price breaks the level of 17.43 and holds below it. The expected trading range for today is between 17.50 support and 18.00 resistance. Read more: https://www.instaforex.com/forex_analysis/87810 |
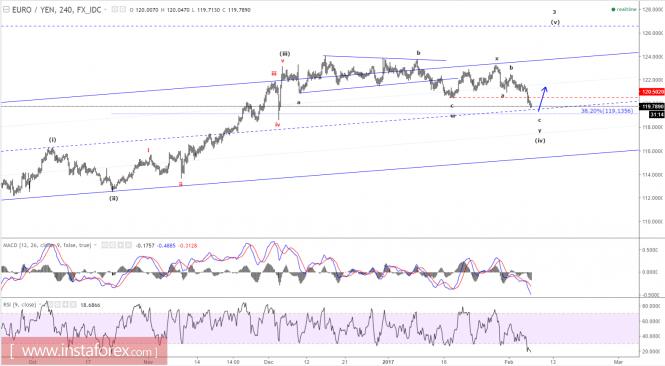
Elliott wave analysis of EUR/JPY for February 7, 2017 https://forex-images.instaforex.com/userfiles/20170207/analytics58995e748a9a6.png Wave summary: With the break below support at 120.50 we know that an extension lower towards the 38.2% corrective target seen at 119.14 should be expected before wave (iv) finally completes and wave (v) higher to 126.54 can take over. In the short term we need not alone a break back above minor resistance at 120.58, but also a break above resistance at 1.2177 confirms that the correction in wave (iv) is finally complete and wave (v) has taken over for long awaited rally higher to 126.54 to complete wave 3. R3: 121.36 R2: 120.58 R1: 120.23 Pivot: 119,80 S1: 119.60 S2: 119.14 S3: 118.68 Trading recommendation: We will buy EUR at 119,25 or upon a break above 120.58. Read more: https://www.instaforex.com/forex_analysis/87709 |
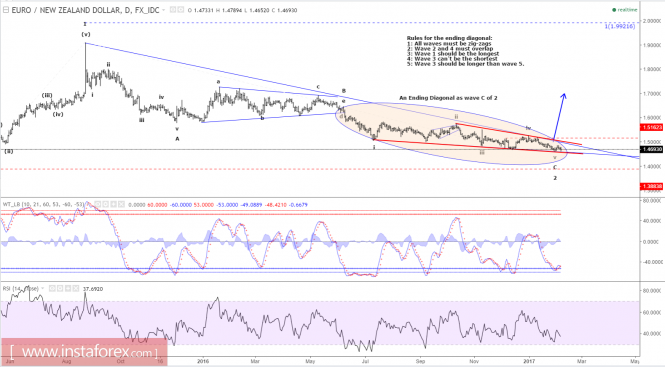
Elliott wave analysis of EUR/NZD for February 6 - 2017 https://forex-images.instaforex.com/userfiles/20170206/analytics58983dfeeb947.png Wave summary: The correction from 1.9114 has extended and seen a new low at 1.4650. As long as minor resistance at 1.4945 is able to cap the upside, we need to allow for slightly lower to 1.4560 to complete this extremely complex ending diagonal, which has been unfolding since June 2016. Only a break above minor resistance at 1.4945 will ease the downside pressure, while a break above resistance at 1.5282 will be needed to confirm that wave 2 finally has completed and wave 3 has taken over for a new long-term impulsive rally that ultimately should take this cross above 1.9114. R3: 1.5282 R2: 1.4953 R1: 1.4867 Pivot: 1.4675 S1: 1.4654 S2: 1.4560 S2: 1.4449 Trading recommendation: Our top at 1.4650 has been hit for a loss. We will only buy a break above 1.4945. Read more: https://www.instaforex.com/forex_analysis/87671 |
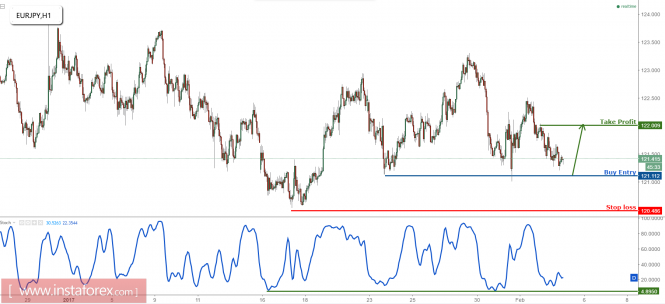
EUR/JPY profit target reached, prepare to turn bullish The price has dropped perfectly as expected and reached our profit target. We prepare to turn bullish above 121.11 support (Fibonacci projection, horizontal support, and Fibonacci retracement) for a bounce up to at least 122.00 resistance (Fibonacci retracement, swing high resistance). Stochastic (21,5,3) is approaching strong support at 4.9% where we expect a bounce from. Buy above 121.11. Stop loss is at 120.48. Take profit is at 122.00. https://forex-images.instaforex.com/userfiles/20170203/analytics589491aa1e0a1.png Read more: https://www.instaforex.com/forex_analysis/87637 |
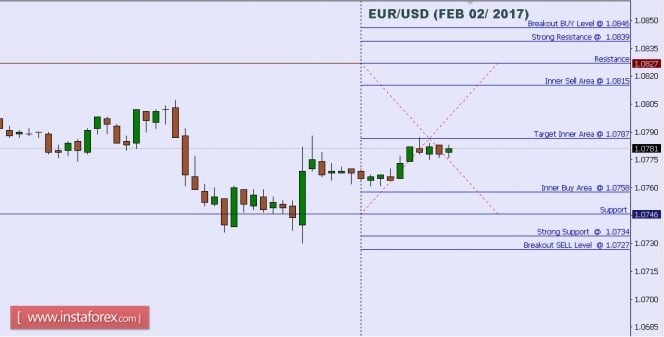
Technical analysis of EUR/USD for Feb 02, 2017 https://forex-images.instaforex.com/userfiles/20170202/EURUSD.jpg When the European market opens, some Economic Data will be released, such as French 10-y Bond Auction, PPI m/m, ECB Economic Bulletin, and Spanish Unemployment Change. The US will release the economic data, too, such as Natural Gas Storage, Prelim Unit Labor Costs q/q, Prelim Nonfarm Productivity q/q, Unemployment Claims, and Challenger Job Cuts y/y, so, amid the reports, EUR/USD will move in a low to medium volatility during this day. TODAY'S TECHNICAL LEVEL: Breakout BUY Level: 1.0846. Strong Resistance:1.0839. Original Resistance: 1.0827. Inner Sell Area: 1.0815. Target Inner Area: 1.0787. Inner Buy Area: 1.0758. Original Support: 1.0746. Strong Support: 1.0734. Breakout SELL Level: 1.0727. Disclaimer: Trading Forex (foreign exchange) on margin carries a high level of risk, and may not be suitable for all investors. The high degree of leverage can work against you as well as for you. Before deciding to invest in foreign exchange you should carefully consider your investment objectives, level of experience, and risk appetite. The possibility exists that you could sustain a loss of some or all of your initial investment and therefore you should not invest money that you cannot afford to lose. You should be aware of all the risks associated with foreign exchange trading, and seek advice from an independent financial advisor if you have any doubts. Read more: https://www.instaforex.com/forex_analysis/87547 |
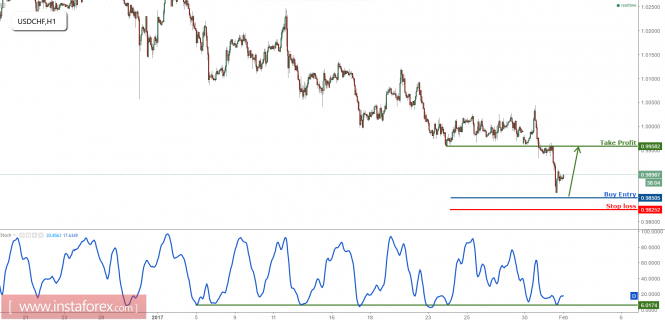
USD/CHF remains bullish above major support We are bullish above 0.9850 support (long-term gold ratio retracement, price action) for a bounce to at least 0.9958 resistance (Fibonacci retracement, horizontal overlap resistance). Stochastic (21,5,3) is seeing strong support above 6%. Buy above 0.9850. Set stop loss at 0.9825 and take profit at 0.9958. https://forex-images.instaforex.com/userfiles/20170201/analytics5891fe15ae884.png |
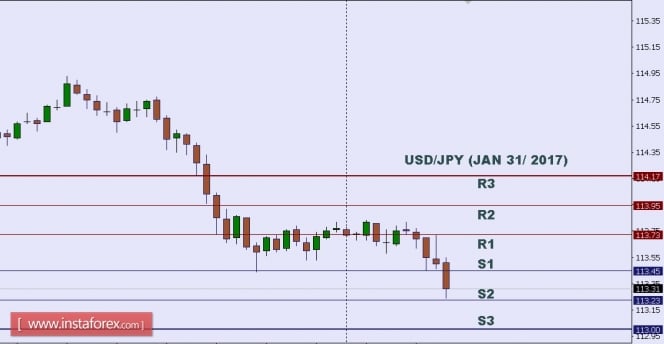
Technical analysis of USD/JPY for Jan 31, 2017 https://forex-images.instaforex.com/userfiles/20170131/USDJPY.jpg In Asia, Japan will release the Housing Starts y/y, BOJ Policy Rate, BOJ Outlook Report, BOJ Press Conference, Monetary Policy Statement, Prelim Industrial Production m/m, Unemployment Rate, and Household Spending y/y data, and the US will release some Economic Data, such as CB Consumer Confidence, Chicago PMI, S&P/CS Composite-20 HPI y/y, and Employment Cost Index q/q. So, there is a probability the USD/JPY will move with low to medium volatility during this day. TODAY'S TECHNICAL LEVEL: Resistance. 3: 114.17. Resistance. 2: 113.95. Resistance. 1: 113.73. Support. 1: 113.45. Support. 2: 113.23. Support. 3: 113.00. Disclaimer: Trading Forex (foreign exchange) on margin carries a high level of risk, and may not be suitable for all investors. The high degree of leverage can work against you as well as for you. Before deciding to invest in foreign exchange you should carefully consider your investment objectives, level of experience, and risk appetite. The possibility exists that you could sustain a loss of some or all of your initial investment and therefore you should not invest money that you cannot afford to lose. You should be aware of all the risks associated with foreign exchange trading, and seek advice from an independent financial advisor if you have any doubts. Read more: https://www.instaforex.com/forex_analysis/87451 |
3,000,000 traders worldwide choose InstaForex Just two years ago we crossed another threshold as the number of our clients exceeded 2,000,000. And today our team has become even bigger. In the new year of 2017, over 3,000,000 clients have already been trading with InstaForex. Of course, such an achievement has been possible only thanks to efforts and professional work of our close-knit team. Thank you for your active participation in the company's history! We promise to keep pleasing you with beneficial trading conditions, bonuses and contests and will do everything that it takes to make trading enjoyable for you. Open a trading account with our company and become a part of the InstaForex traders society! https://forex-images.instaforex.com/company_news/userfiles/insta.png |
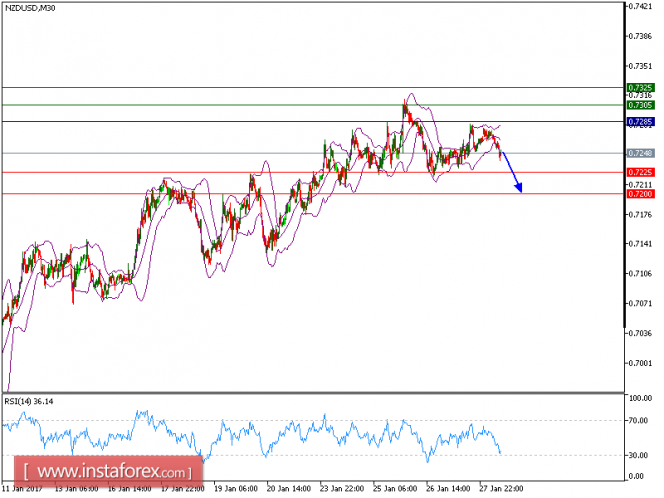
Technical analysis of NZD/USD for January 30, 2017 https://forex-images.instaforex.com/userfiles/20170130/NZDUSDM30.png NZD/USD is expected to ttrade with bearish bias. The pair is trading below its 20-period and 50-period moving averages, which play resistance roles and maintain the bearish bias. The relative strength index is supported by a bearish trend line and is above its neutrality level at 50. Additionally, 0.7285 is playing a key resistance role, which should limit the upside potential. As long as the resistance holds at this key level, look for a further downside to 0.7225 and even 0.7200 in extension. The pair is trading below its pivot point. It is likely to trade in a lower range as long as it remains below the pivot point. Short positions are recommended with the first target at 0.7225. A break below this target will move the pair further downwards to 0.7200. The pivot point stands at 0.7285. If the price moves in the opposite direction and bounces back from the support level, it will move above its pivot point. It is likely to move further to the upside. According to that scenario, long positions are recommended with the first target at 0.7305 and the second one at 0.7325. Resistance levels: 0.7305, 0.7325, 0.7340 Support levels: 0.7225, 0.7200, 0.7175 Read more: https://www.instaforex.com/forex_analysis/87411 |
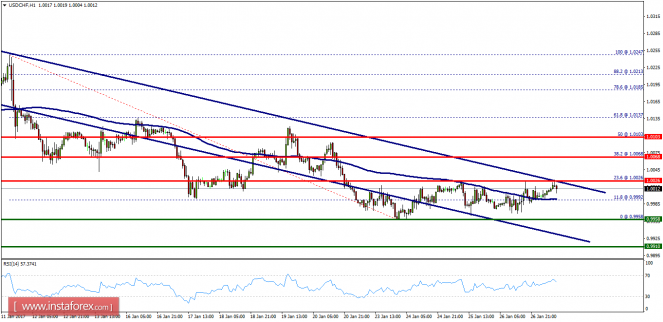
Technical analysis of USD/CHF for January 27, 2017 https://forex-images.instaforex.com/userfiles/20170127/USDCHFH1.png Overview: The USD/CHF pair rose from the level of 0.9960 towards 1.0015 yesterday. Now, the current price is set at 1.0010. On the H1 chart, the resistance is seen at the levels of 1.0026. Besides, the daily bottom is seen at the level of 0.9958. Today, the USD/CHF pair is continuing moving in a bullish trend from the new support level of 0.9958 to form a bullish channel. Amid the previous events, we expect the pair to move between 0.9958 and 1.0068. Therefore, buy above the level of 0.9958 with the first targets at 1.0026 and 1.0068 in order to test the daily resistance 2. However, if the pair fails to pass through the level of 1.0068, the market will indicate a bearish opportunity below the level of 1.0068. The market will decline further to 0.9958 in order to return to the double bottom. Additionally, a breakout of that target will move the pair further downwards to 0.9910. Read more: https://www.instaforex.com/forex_analysis/87355 |
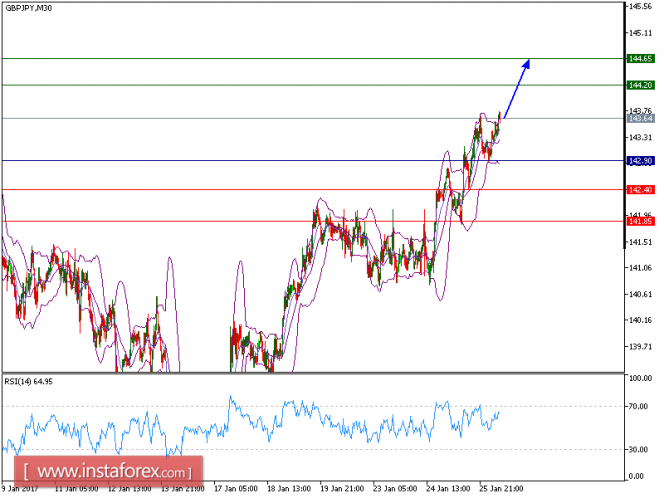
Technical analysis of GBP/JPY for January 26, 2017 https://forex-images.instaforex.com/userfiles/20170126/1485415571_GBPJPYM30.png GBP/JPY is expected to extend its upside movement. The pair recorded a succession of higher tops and higher bottoms, which confirms a positive view. The rising 20-period and 50-period moving averages further reinforced the upward momentum. The relative strength index is above its neutrality level at 50. As long as 142.90 holds as key support, look for a further upside to 144.20 and even 144.65 in extension. The pair is trading above its pivot point. It is likely to trade in a wider range as long as it remains above its pivot point. Therefore, long positions are recommended with the first target at 144.20 and the second one at 144.65. In the alternative scenario, short positions are recommended with the first target at 142.40 if the price moves below its pivot points. A break of this target is likely to push the pair further downwards, and one may expect the second target at 141.85. The pivot point is at 142.90. Resistance levels: 144.20, 144.65, 145.25 Support levels: 142.40, 141.35,140.65 Read more: https://www.instaforex.com/forex_analysis/87271 |
Technical analysis of NZD/USD for January 25, 2017 https://forex-images.instaforex.com/userfiles/20170125/NZDUSDH1.png Overview: The NZD/USD pair is likely to continue straight from the level of 0.7208. Support at 0.7208 coincides with ratio of 78.6% Fibonacci retracement level on the H1 chart. Additionally, it is probably tend to form a double bottom at the same level. Therefore, the kiwi shows signs of strength following the break through the highest levels of 0.7208. So, it is going to be a good sign to buy above the support levels of 0.7208 with the first target at 0.7276 in order to retest the double top. If the trend can break the point of 0.7276, it will continue towards the next target of 0.7315. However, in case a reversal takes place and the NZD/USD pair breaks through the support level at 0.7208, the pair will be led to a further decline to 0.7155 and 0.7118 in order to indicate the bearish market. But in overall, we still confirm the bullish scenario as the trend is still above the major support of 0.7208. Read more: https://www.instaforex.com/forex_analysis/87219 |
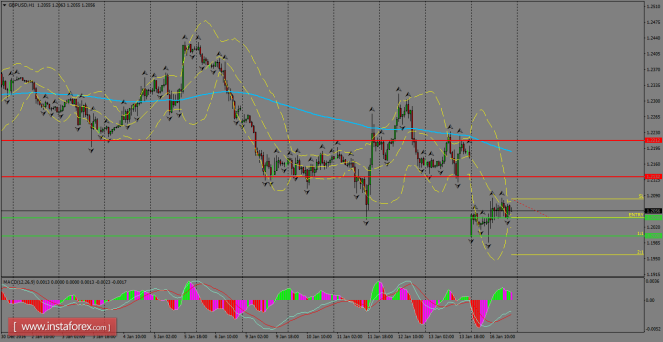
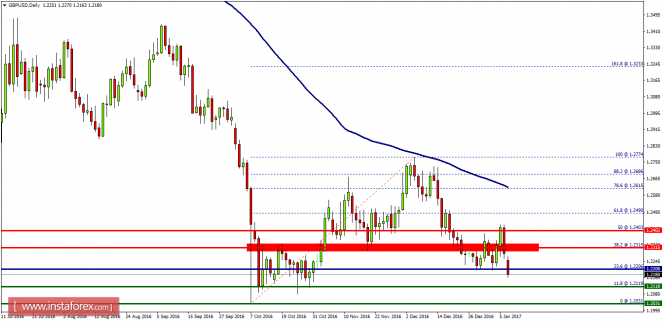
Daily analysis of GBP/USD for January 24, 2017 The pair is posting fresh multi-week highs across the board, ahead of the UK Supreme Court's ruling on Brexit. We can expect high volatility whatever the ruling could be at the end and if GBP/USD attempts a rally from current stage, then it can test the resistance level of 1.2566, looking for the 1.2645 zone, while a pullback could push lower the Cable to test the 200 SMA. https://forex-images.instaforex.com/userfiles/20170123/GBPUSDH1.png H1 chart's resistance levels: 1.2566 / 1.2645 H1 chart's support levels: 1.2475 / 1.2391 Trading recommendations for today: Based on the H1 chart, buy (long) orders only if the GBP/USD pair breaks a bullish candlestick; the resistance level is at 1.2566, take profit is at 1.2645 and stop loss is at 1.2487. Read more: https://www.instaforex.com/forex_analysis/87149 |
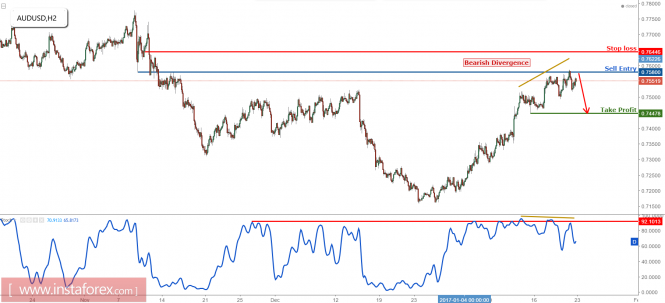
AUD/USD remain bearish below major resistance We remain bearish below major resistance at 0.7580 (Fibonacci retracement, Fibonacci projection, horizontal overlap resistance) and we expect a steep continued drop from this level to at least 0.7447 support (Fibonacci retracement, swing low support). Stochastic (21,5,3) remain at 92% resistance and sees bearish divergence vs price signalling a reversal is fast approaching. Sell below 0.7580. Stop loss at 0.7644. Take profit at 0.7447. https://forex-images.instaforex.com/userfiles/20170123/analytics5885cf4771138.png Read more: https://www.instaforex.com/forex_analysis/87117 |
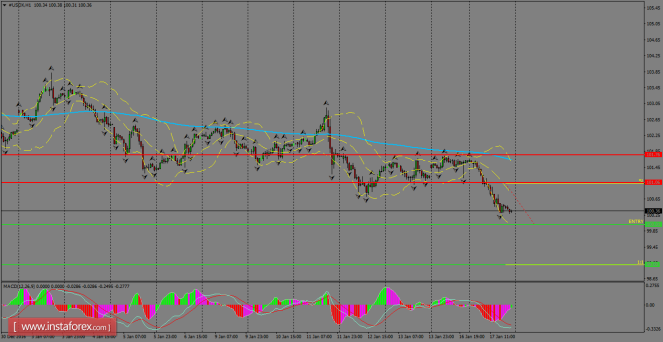
Daily analysis of USDX for January 18, 2017 The index plummeted during Tuesday's session, as the bears gained traction to the south and so far, USDX is looking to reach the 100.00 level. If we see a breakout below that area, it's likely to see another push lower toward 99.00. To the upside, we can expect resistances at the 101.06 and 101.76 levels, and the latest area coincides with the 200 SMA at H1 chart. https://forex-images.instaforex.com/userfiles/20170117/USDXH1.png H1 chart's resistance levels: 101.06 / 101.76 H1 chart's support levels: 100.01 / 99.00 Trading recommendations for today: Based on the H1 chart, place sell (short) orders only if the USD Index breaks with a bearish candlestick; the support level is at 100.01, take profit is at 99.00 and stop loss is at 101.03. Read more: https://www.instaforex.com/forex_analysis/86914 |
Daily analysis of GBP/USD for January 17, 2017 Following the strong bearish gap is seen on Monday's Asia opening, GBP/USD managed to recover above the 1.2000 handle and it's now being supported by the 1.2040 level. If the rebound extends in coming days, we can expect a rally's attempt toward the 1.2132 level, which is very close to the 200 SMA at H1 chart to fill the gap. MACD indicator is favoring that scenario, as it stays in the positive territory. https://forex-images.instaforex.com/userfiles/20170116/1484598899_GBPUSDH1.png H1 chart's resistance levels: 1.2132 / 1.2212 H1 chart's support levels: 1.2040 / 1.2000 Trading recommendations for today: Based on the H1 chart, sell (short) orders only if the GBP/USD pair breaks a bearish candlestick; the support level is at 1.2040, take profit is at 1.2000 and stop loss is at 1.2082. Read more: https://www.instaforex.com/forex_analysis/86856 |
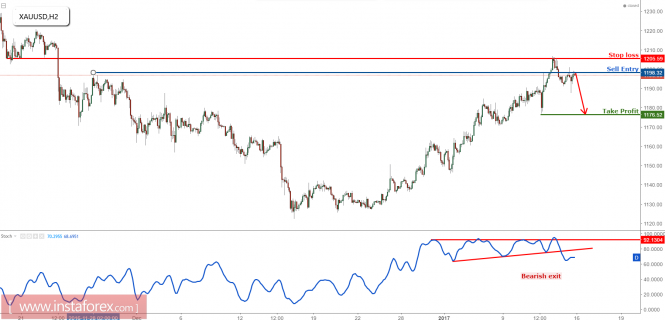
XAU/USD at major resistance, time to sell We turn bearish below $1,198 resistance (Fibonacci retracement, horizontal resistance) as we prepare to see a strong move down to $1,176 support (Fibonacci retracement, recent swing low support, Fibonacci projection). Stochastic (21,5,3) is seeing strong resistance below 92% and we also are starting to see the bearish exit of stochastic signalling a strong drop is expected soon. Sell below $1,198. Stop loss at $1,205. Take profit at $1,176. https://forex-images.instaforex.com/userfiles/20170116/analytics587c9db02bacf.png Read more: https://www.instaforex.com/forex_analysis/86840 |
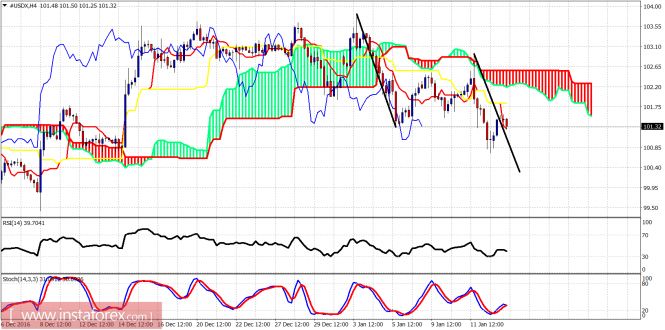
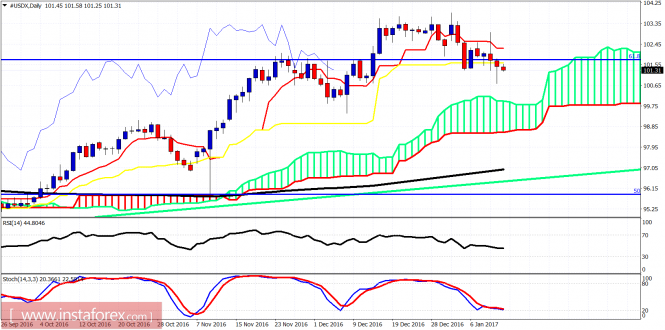
Technical analysis of USDX for January 13, 2017 The Dollar index remains in a bearish short-term trend and our target of 100.40 remains intact and very possible to be achieved even today. Any bounce should be sold and as long as price is below 102.50 trend will remain bearish. However, the form of the decline implies that this downward move is corrective. https://forex-images.instaforex.com/userfiles/20170113/analytics58788af82feb8.png The Dollar index remains below the 4-hour Ichimoku cloud. Resistance is at 102.50. Support is at 100-100.40. Trend remains bearish in the short-term and a new lower low remains possible as there are no signs of a bullish divergence. https://forex-images.instaforex.com/userfiles/20170113/analytics58788b333b4b9.png On a daily basis,trend is showing reversal signs but price remains above the Ichimoku cloud. Price has broken below the tenkan- and kijun-sen (the red and yellow line indicators) implying increased chances of approaching the Kumo (cloud) at 100. I remain short-term bearish but will look to cover short positions near 100 as a bounce will be justified from those levels. Read more: https://www.instaforex.com/forex_analysis/86766 |
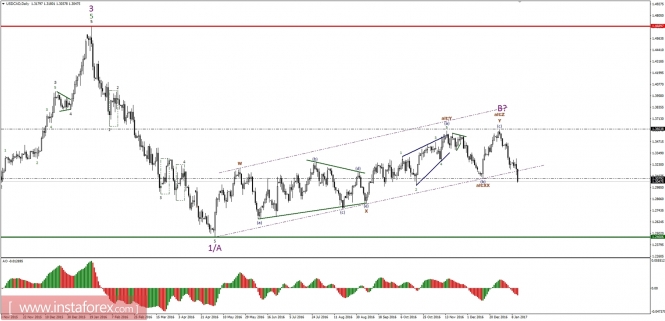
Technical analysis of USD/CAD for January 12, 2017 General overview for 12/01/2017: The blue impulsive count of 1/(a) had been invalidated when the level of 1.3080 was violated. Currently, the next best fit of the Elliott wave progression would indicate, that the top for the wave C (blue) of the wave Y (brown) would have terminated at the level of 1.3600. This level would be the top for the larger time frame wave B (purple), as per daily time frame chart. All of this suggest more decline towards the lows of the wave A (purple) around the level of 1.2460 and an eventual breakout lower. Nevertheless, please notice, this recent leg down might be still just a part of some larger corrective cycle. Support/Resistance: 1.3600 - Wave B Top 1.3230 - Dashed Purple Channel Support 1.3080 - Technical Support Trading recommendations: Day traders and swing traders should refrain from trading as the market is evolving into more complex corrective cycle, which is full of whipsaws and false breakouts. Please wait for the next trading setup to occur shortly. https://forex-images.instaforex.com/userfiles/20170112/analytics58774f89b77f0.jpg Read more: https://www.instaforex.com/forex_analysis/86728 |
Win Lamborghini Huracan in InstaForex campaign! InstaForex informs you of a new campaign! This time, we raffle off a Lamborghini Huracan, a premium sports car of over 500 horsepower from the legendary Italian car manufacturer. The keys to one of the most expensive cars in the world will be presented to an accidental trader who will be selected by means of a so-called Lamborghini-number. On the final day, Forex rates of five currency pairs will be fixed exactly at the closing bell. The mega campaign is held from December 26, 2016 until December 20, 2019. Anyone can become a lucky owner of the posh coupé. A trader should deposit at least $1,000 to a trading account and register for the campaign. Believe us that everyone has a fair chance to win a gorgeous sports car. Our company has always raffled off the most expensive posh cars. Besides, InstaForex has achieved leadership among other brokers in terms of bonus funds. Join InstaForex campaign and win a dream car! https://forex-images.instaforex.com/company_news/userfiles/Lamborghini_-510x350_en.png |
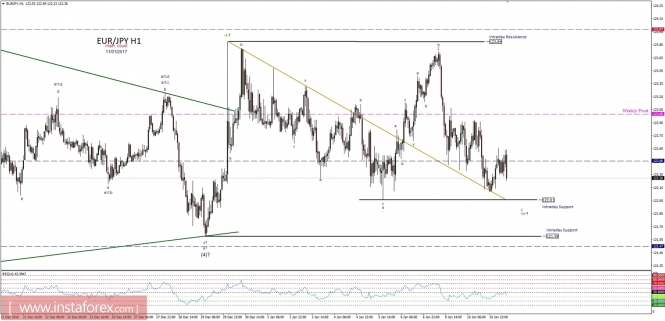
Technical analysis of EUR/JPY for January 11, 2017 General overview for 11/01/2017: The count is evolving into a more complex and time-consuming corrective cycle in wave -ii-. The preferred labeling is suggesting an uncompleted irregular flat correction as the unfolding pattern in wave -ii-. The current labeling suggests more impulsive wave progression to come shortly, but the key to the upside levels is the wave (i) high at the level of 123.84. This line must be clearly violated, so the impulsive structure could develop. Otherwise, the corrective cycle in the blue wave (4) will evolve into an even more complex and time-consuming structure. Support/Resistance: 123.97 - WR1 123.84 - Intraday Resistance 123.00 - Weekly Pivot 122.46 - WS1 122.01 - Intraday Support 121.59 - Black Impulsive Count Invalidation Level 121.47 - WS2 Trading recommendations: Day traders should consider opening buy orders only if the level of 123.84 is clearly violated. The uncompleted wave progression to the upside supports this view. https://forex-images.instaforex.com/userfiles/20170111/analytics5875ed34505e0.jpg Read more: https://www.instaforex.com/forex_analysis/86668 |
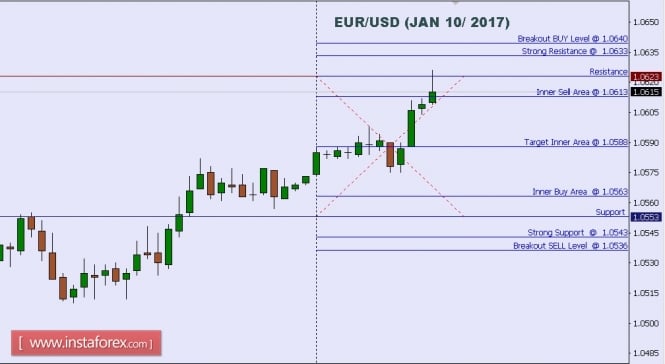
Technical analysis of EUR/USD for Jan 10, 2017 https://forex-images.instaforex.com/userfiles/20170110/EURUSD.jpg When the European market opens, some economic data will be released such as French Industrial Production m/m. The US will release the economic news too such as Final Wholesale Inventories m/m, JOLTS Job Openings, and NFIB Small Business Index. So amid the reports, EUR/USD will move with low to medium volatility during this day. TODAY'S TECHNICAL LEVELS: Breakout BUY Level: 1.0640. Strong Resistance:1.0633. Original Resistance: 1.0623. Inner Sell Area: 1.0613. Target Inner Area: 1.0588. Inner Buy Area: 1.0563. Original Support: 1.0553. Strong Support: 1.0543. Breakout SELL Level: 1.0536. Disclaimer: Trading Forex (foreign exchange) on margin carries a high level of risk, and may not be suitable for all investors. The high degree of leverage can work against you as well as for you. Before deciding to invest in foreign exchange you should carefully consider your investment objectives, level of experience, and risk appetite. The possibility exists that you could sustain a loss of some or all of your initial investment and therefore you should not invest money that you cannot afford to lose. You should be aware of all the risks associated with foreign exchange trading, and seek advice from an independent financial advisor if you have any doubts. Read more: https://www.instaforex.com/forex_analysis/86594 |
Technical analysis of GBP/USD for January 09, 2017 https://forex-images.instaforex.com/userfiles/20170109/GBPUSDDaily.png Overview: The GBP/USD pair continues to move downwards from the level of 1.2315, which represents the double top on the daily chart. Last week, the pair dropped from the level of 1.2315 to the bottom around 1.2175. Today, the first resistance level is seen at 1.2206 followed by 1.2315, while daily support is seen at the levels of 1.2118 and 1.2031. According to the previous events, the GBP/USD pair is still moving between the levels of 1.2206 and 1.2031 in coming hours. The first resistance stands at 1.2206, for that if the GBP/USD pair fails to break through the resistance level of 1.2206, the market will decline further to 1.2118. This would suggest a bearish market because the RSI indicator is still in a negative area and does not show any trend-reversal signs. The pair is expected to drop lower towards at least 1.2050 in order to test the second support (1.2031). On the contrary, if a breakout takes place at the resistance level of 1.2315(the double top), then this scenario may become invalidated resistance of 1.2315. Read more: https://www.instaforex.com/forex_analysis/86550 |
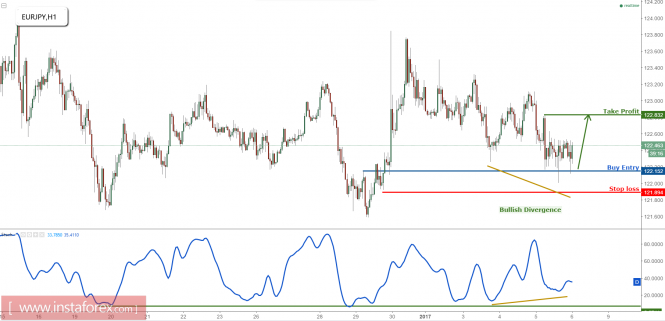
EUR/JPY remain bullish above major support Price is above major support at 122.15 (Fibonacci retracement, horizontal overlap support, bullish divergence) and we expect a rise above this level to at least 122.83 resistance (Fibonacci retracement, recent swing high resistance). Stochastic (21,5,3) is bouncing above our support and displays bullish divergence vs price. Buy above 122.15. Stop loss at 121.89. Take profit at 122.83. https://forex-images.instaforex.com/userfiles/20170106/analytics586f6bc0d8703.png Read more: https://www.instaforex.com/forex_analysis/86498 |
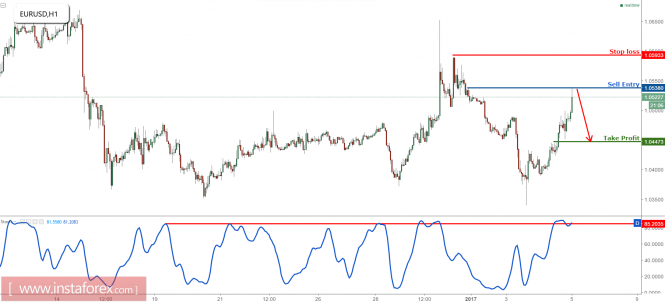
EUR/USD profit target reached, time to turn bearish Price is approaching major resistance at 1.0538 (Fibonacci retracement, bearish candlestick reversal) and we expect a drop from this level towards 1.0447 support (Fibonacci retracement, horizontal overlap support). Stochastic (21,5,3) is also seeing major resistance at the 85% level. Sell below 1.0538. Stop loss at 1.0593. Take profit at 1.0447. https://forex-images.instaforex.com/userfiles/20170105/analytics586de886a738a.png Read more: https://www.instaforex.com/forex_analysis/86420 |
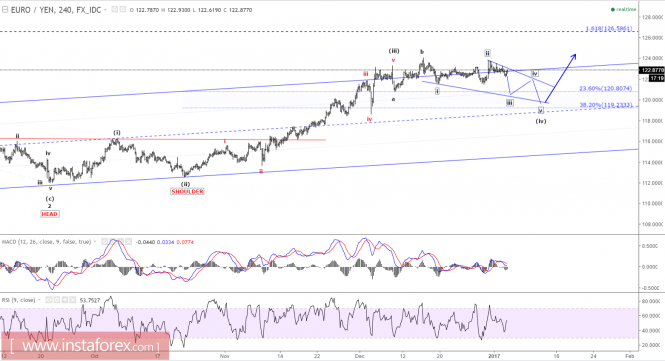
Elliott wave analysis of EUR/JPY for January 4, 2017 https://forex-images.instaforex.com/userfiles/20170104/analytics586c8cb99d022.png Wave summary: The complex correction in wave (iv) continues to unfold in a very slow fashion. We are still looking for the possibility of a deeper corrective decline closer to 119.23. Since it is a wave four correction and we had a good idea that it would turn out to be complex from the onset of this wave, so no real surprise here. Resistance is seen at 123.33, but only a break above 123.85 will indicate that this wave (iv) correction already has completed and wave (v) higher to 126.54 is developing. Trading recommendation: We are looking for a buying opportunity at 119.45 or upon a break above 123.85. Read more: https://www.instaforex.com/forex_analysis/86364 |
EUR/USD Technical Analysis for January 03, 2017. https://forex-images.instaforex.com/userfiles/20170103/eurusd03012017.jpg Technical outlook and chart setups: The EUR/USD pair looks to have finally pushed through the larger trend that is down and ruled out the former probability of an expanded flat discussed yesterday. The pair has pushed lower through 1.0400/1.0380 levels today and is seen to be trading at 1.0390 level for now, testing an intermediary support trend line as depicted here. Please note that 1.0650 level should act as formidable resistance now and selling on rallies should be the preferred strategy going ahead. It is now recommended to sell through 1.0550/55 levels, which is fibonacci 0.618 resistance of the entire drop between 1.0650 and 1.0380 levels respectively, with risk above 1.0650 level. Immediate support is seen at 1.0380 level, while resistance is seen at 1.0670 level respectively. Trading recommendations: Sell around 1.0550 levels, stop at 1.0670, target 1.0000 Good luck! Read more: https://www.instaforex.com/forex_analysis/86342 |
New winners of regular InstaForex contests defined Another series of InstaForex contests have come to an end. Today, we are ready to announce winners of seven contests and campaigns: One Million Option, InstaForex Sniper, FX-1 Rally, Lucky Trader, Chancy Deposit, and Great Race, as well as Trade Wise, Win Device. Our company sincerely congratulates the victors and wishes other contestants to find their names in next digests. One Million Option One Million Option is one of the most popular InstaForex contests. Every step gathers hundreds of participants who fight for the title of the best options trader. The best result was shown by Viktor Khovratovich. The next stage is to start pretty soon, on January 2, 2017 and will run till January 6, 2017. InstaForex Sniper The InstaForex Sniper contest attracts the sharpest and fastest traders. Many participants compete fiercely for the main prize. The results of the latest stage showed that it was Sujono who snatched the victory. The next stage will be held from January 2, 2017 to January 6, 2017. Lucky Trader Confidence, prudence, and concentration on success are the key to an excellent result in the two-week marathon Lucky Trader. If you manage to trade perfectly for two weeks, just like Ruslan Demidov did it, you will also have a chance to become the victor. The next stage will start on January 9, 2017 and end on January 20, 2017. FX-1 Rally The best performance in the FX-1 Rally contest was demonstrated by Alenksandr Grigoriev, who managed to use all of his trading and racing skills efficiently. We congratulate the winner on the outstanding victory and wish him luck in next competitions. If you want to feel the thrilling spirit of this fight, welcome to the start of another stage of the FX-1 Rally contest. You can register for the nearest rally that will take place from 00:00 December 30, 2016 to 23:59 December 30, 2016. Trade Wise, Win Device Ilya Terzi became the victor of the Trade Wise, Win Device campaign and the owner of a new Galaxy Tab. The upcoming step of the campaign will show whether you are lucky enough to win a branded gadget too. The new stage will take place from January 2, 2017 to January 13, 2017. You can register for the campaign on its web page right now. Chancy Deposit In this contest everything depends on sheer luck. If you get lucky, you will become a winner of the Chancy Deposit contest and receive an impressive money prize, just like Ardian Suryo Anggoro did it lately. InstaForex Great Race The recent stage of InstaForex Great Race 2016 was won by Albert Udaev. We congratulate the winner and other traders who managed to take prize places. Learn more about contests Photos and comments of the finalists |
Daily analysis of GBP/USD for December 30, 2016 The pair is headed to close the year above the 1.2185 demand zone, following a recovery's session on Thursday. Currently, GBP/USD is trying to reach the 200 SMA at H1 chart and if it manages to break above the 1.2300 handle, then that scenario is likely to happen in the short-term. However, that moving average should be acting as dynamic resistance. https://forex-images.instaforex.com/userfiles/20161229/GBPUSDH1.png H1 chart's resistance levels: 1.2250 / 1.2317 H1 chart's support levels: 1.2185 / 1.2121 Trading recommendations for today: Based on the H1 chart, sell (short) orders only if the GBP/USD pair breaks a bearish candlestick; the support level is at 1.2185, take profit is at 1.2121 and stop loss is at 1.2250. Read more: https://www.instaforex.com/forex_analysis/86174 |


1 2 3 4 5 6 7 8 ... 10 11 12 13 14 15 16 17 18 (of 19 pages)