Instaforexbuk's Posts
Nairaland Forum › Instaforexbuk's Profile › Instaforexbuk's Posts
1 2 3 4 5 6 7 8 9 10 (of 19 pages)
horlajumokhe:You may find the agreement in the section "For traders" - "InstaForex bonuses" - "InstaForex bonuses": https://secure.instaforex.com/en/agreement/startupbonus?agree=true |
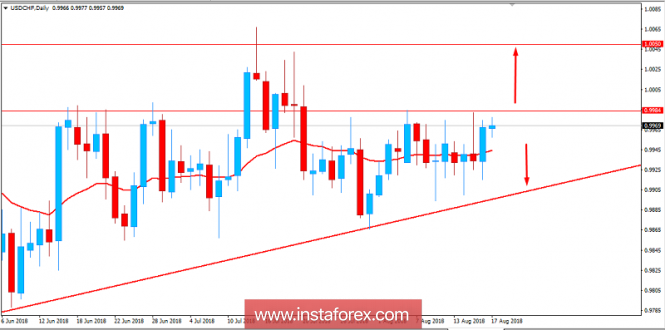
Fundamental Analysis of USD/CHF for August 17, 2018 USD/CHF has been quite volatile and corrective recently which is heading towards the resistance area of 0.9980 with certain bullish pressure. CHF has been struggling recently with the economic reports, whereas USD has been performing better than expected which leads the bullish pressure to continue with certain squeeze on the upside. Recently, CHF PPI report has been published with a decrease to 0.1% from the previous value of 0.2% which was expected to increase to 0.3%. The worse economic results did empower USD to gain good momentum over CHF, whereas ahead of the upcoming CHF Trade Balance report, certain volatility may remain in the market. On the USD side, Retail Sales report has recently been published with an increase to 0.5% from the previous value of 0.2% which was expected to decrease to 0.1% and Core Retail Sales also has increased to 0.6% from the previous value of 0.2% which was expected to be at 0.3%. The positive economic results did provide the needed boost for the currency, whereas CHF was struggling to impress the market sentiment. Today, USD Prelim UoM Consumer Sentiment report is going to be published which is expected to increase to 98.1 from the previous figure of 97.9 and CB Leading Index is expected to decrease to 0.4% from the previous value of 0.5%. As of the current scenario, ahead of the CHF Trade Balance next week, USD is expected to remain consistent with the gains having better economic results backing it. As USD manages to publish better reports, further gain on the bullish side is expected in this pair. Now let us look at the technical view. The price is currently residing at the edge of the 0.9980 area from where a daily close above it is expected to inject further bullish momentum in the pair which is more likely as of the current price formation. As the price closes above 0.9980 with a daily close, further bullish momentum with target towards the 1.0050 area is expected. On the other hand, if the price fails to break above 0.9980, certain bearish pressure is expected which will continue the bullish squeeze further in the coming days. SUPPORT: 0.9850 RESISTANCE: 0.9980, 1.0050 BIAS: BULLISH MOMENTUM: VOLATILE https://forex-images.ifxdb.com/userfiles/20180817/analytics5b765bea022b3.png Read more: https://www.instaforex.com/forex_analysis/122208 |
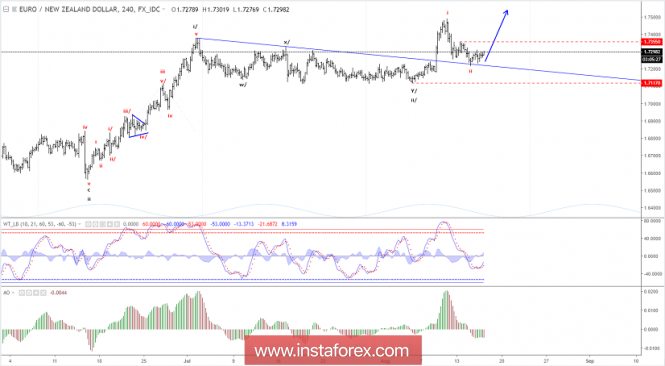
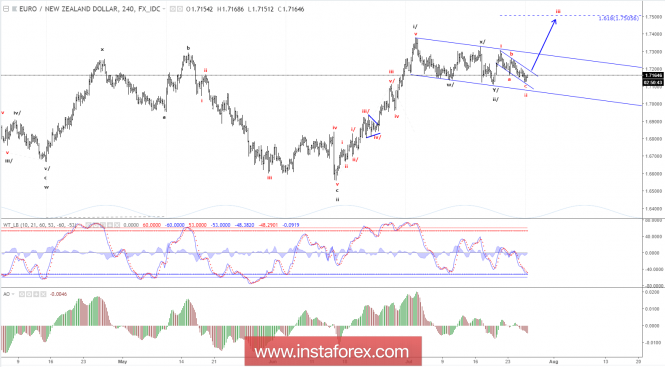
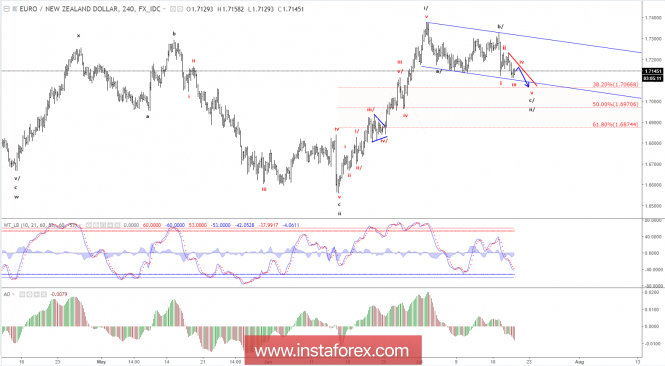
Elliott wave analysis of EUR/NZD for August 16, 2018 https://forex-images.ifxdb.com/userfiles/20180816/analytics5b74eb43af5cd.png A break above resistance at 1.7355 is still needed to confirm that red wave ii has completed and red wave iii to above 1.7484 is developing. Short-term, we see support at 1.7262 and again at 1.7238. The later will ideally be able to protect the downside for the break above 1.7355 towards 1.7484 and above, with the next important targets seen at 1.7924 and 1.8369. R3: 1.7484 R2: 1.7417 R1: 1.7355 Pivot: 1.7299 S1: 1.7270 S2: 1.7243 S3: 1.7220 Trading recommendation: We are long EUR from 1.7245 with our stop placed at 1.7215. Read more: https://www.instaforex.com/forex_analysis/122146 |
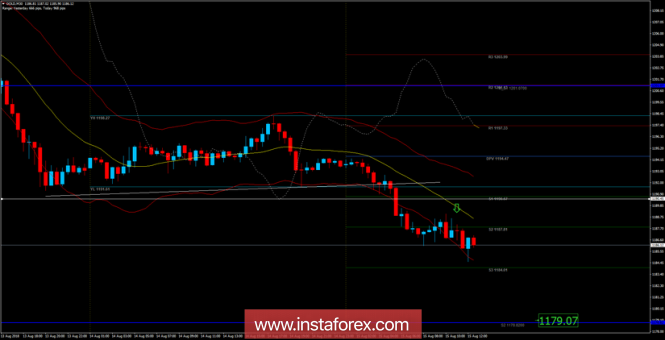
Analysis of Gold for August 15, 2018 https://forex-images.ifxdb.com/userfiles/20180815/analytics5b73f64084c18.png Recently, Gold has been trading downwards. As I expected, the price tested the level of $1,184.20. According to the M30 time – frame, I found a broken bearish flag in the background, which is a sign that sellers are in control. My advice is to watch for potential selling opportunities on the rallies. The downward target is set at the price of $1,179.00. Resistance levels: R1: $1,197.00 R2: $1,201.07 R3: $1,204.00 Support levels: S1: $1,190.65 S2: $1,187.80 S3: $1,184.00 Trading recommendations for today: watch for potential selling opportunities. Read more: https://www.instaforex.com/forex_analysis/122119 |
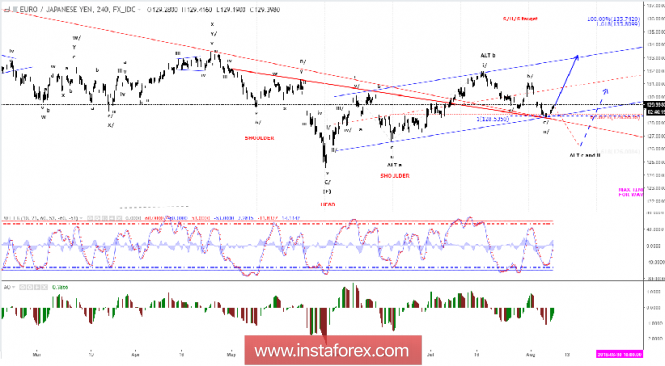
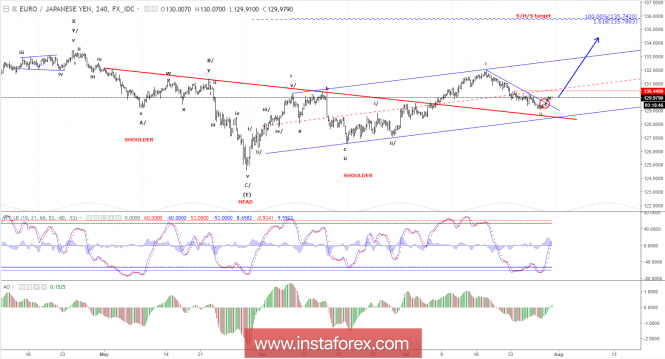
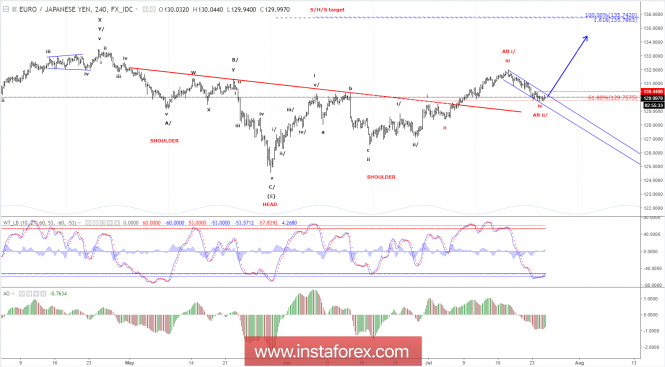
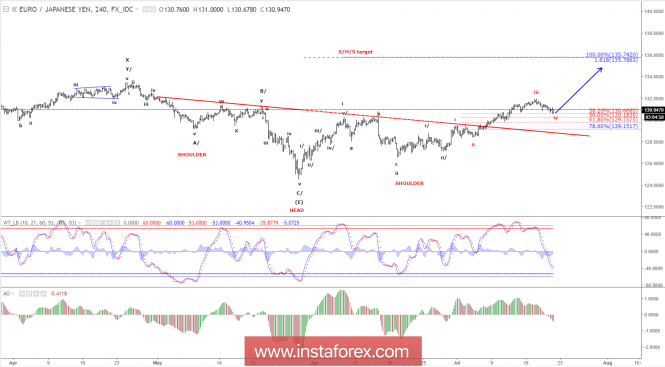
Elliott wave analysis of EUR/JPY for August 8, 2018 https://forex-images.ifxdb.com/userfiles/20180808/analytics5b6a6043f33f1.png EUR/JPY has rallied nicely from the 128.48 low and is ready to test the short-term important resistance at 129.62. This resistance might be spiked, but likely only shortly and then cause a corrective decline to 129.00 before trying to push higher again. To confirm that wave ii/ completed with the 128.48 test, we need a clear break above 129.62 and upside acceleration towards important resistance at 131.15. A break above this resistance confirms our preferred scenario and calls for a rally towards 135.74 - 135.79 next. R3: 130.61 R2: 130.33 R1: 130.08 Pivot: 129.62 S1: 129.24 S2: 129.00 S3: 128.78 Trading recommendation: We are long EUR from 128.72. We will take half profit at 129.50 and keep our stop at 128.45 for the rest. Read more: https://www.instaforex.com/forex_analysis/121680 |
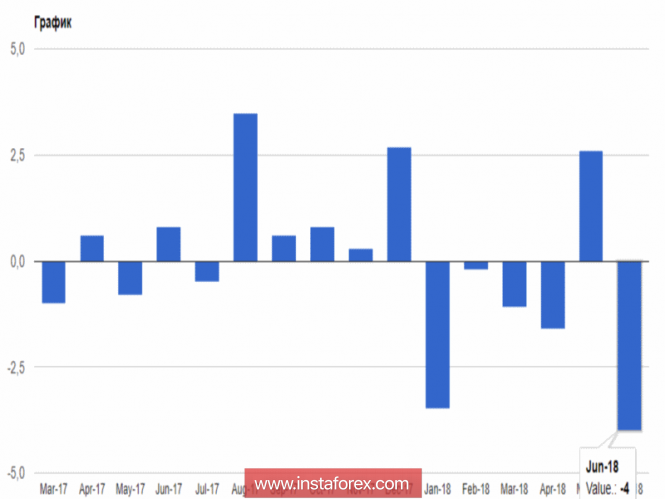
Trump's trade policy continues to work The euro continued to decline against the US dollar in the morning of Monday, August 6, amid the lack of important fundamental statistics, as well as expectations of further interest rate hikes in the United States. Data on the sharp decline in orders in Germany put pressure on risky assets. According to a report by the German Ministry of Economy, production orders in Germany declined sharply in June this year due to falling demand from countries outside the eurozone. This suggests that the current tensions in trade relations are already affecting the indicators, which will further exacerbate tensions between the US and the EU. As indicated in the report, orders in the manufacturing sector in Germany in June 2018 fell by 4.0% compared to May, while economists had forecast a decline in orders by 0.5%. The ministry confirmed the fact that the uncertainty of the prospects of trade policy played a key role. External orders in the German manufacturing sector in June fell by 4.7% compared to May, while domestic production orders decreased 2.8% compared to the previous month. https://forex-images.ifxdb.com/userfiles/20180806/analytics5b684bde52a01.png As I noted above, a particular decrease in orders was observed from countries that are not members of the eurozone. Here the figure fell by 5.9%. Compared to the same period of the previous year, orders in the German manufacturing sector decreased by 0.8%. As for the technical picture of the EUR/USD pair, then, most likely, the pressure on the euro will continue. The breakthrough of support of 1.1530 will lead to new large sales in risky assets, with an exit to the lows of the month in the area of 1.1480 and 1.1440. The only hope of buyers in the short term is a return to the resistance of 1.1565, which will lead to an upward correction in the area of 1.16 and 1.1630. The British pound continued to decline, ignoring the report on the volume of consumer lending in the UK, which in June this year has not changed compared to may. This shows that consumer spending will continue to grow in the future. According to the Bank of England, in June 2018, net consumer lending to consumers in June amounted to 5.4 billion pounds against 5.3 billion pounds in May. Credit cards in June amounted to 1.6 billion pounds. As for mortgage loans, the number was at the level of 65,619. As for the technical picture of the GBP/USD pair, the recovery prospects are also quite far. Brexit and uncertainty with a further increase in interest rates in the UK continue to weigh on the pound. The current main goal of the sellers of the pound is the lows of 1.2890 and 1.2815. If we talk about the prospects for an upward correction, then, apparently, it will be limited in the area of resistances 1.2960 and 1.3000. Read more: https://www.instaforex.com/forex_analysis/211213 |
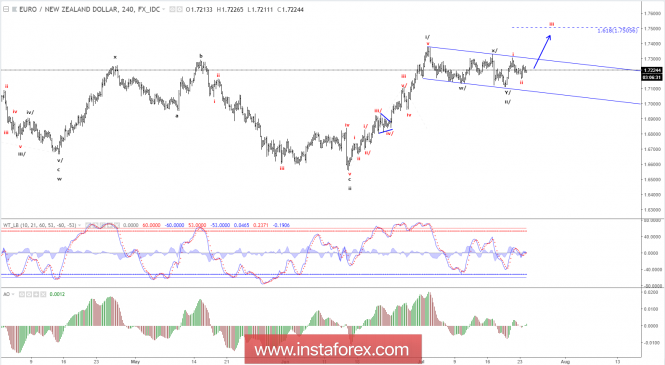
Elliott wave analysis of EUR/NZD for August 6, 2018 https://forex-images.ifxdb.com/userfiles/20160818/analytics57b55cfa36eb7.png EUR/NZD failed to break clearly above resistance at 1.7205 once again, which is disappointing. As long as support at 1.7116 is able to protect the downside we will remain slightly bullish, but the failure to break clearly above resistance the 1.7205 - 1.7224 zone does raise the possibility of the alternate count, that a final dip closer to 1.7066 will be needed before wave ii/ finally completes and wave iii/ will be ready to take over. We will need a clear break above resistance at 1.7224 to confirm that wave iii/ is developing. R3: 1.7224 R2: 1.7180 S1: 1.7155 Pivot: 1.7137 S1: 1.7117 S2: 1.7094 S3: 1.7066 Trading recommendation: We remain long EUR at 1.7226 with our stop placed at 1.7110. If you are not long EUR yet, then wait for a clear break above 1.7224 before committing. Read more: https://www.instaforex.com/forex_analysis/121507 |
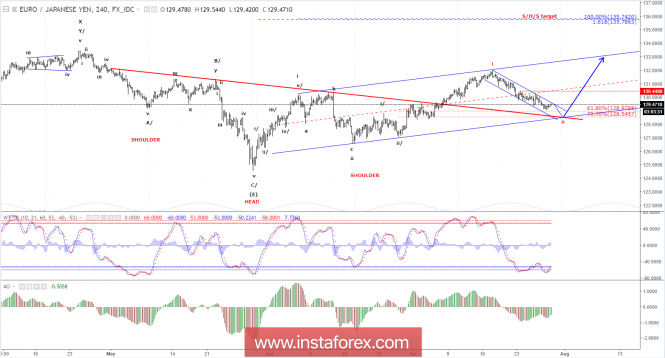
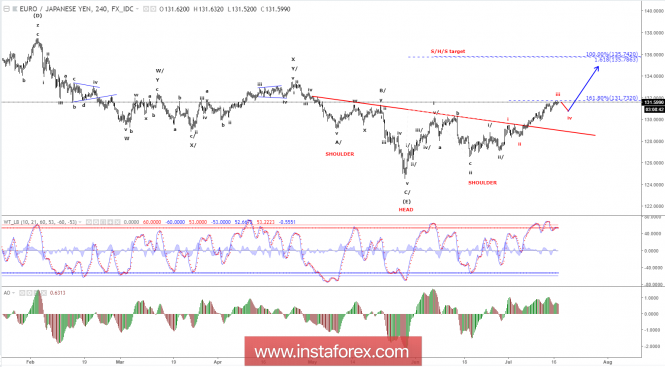
Elliott wave analysis of EUR/JPY for August 1, 2018 https://forex-images.ifxdb.com/userfiles/20180801/analytics5b61231b4ecf4.png EUR/JPY has rallied nicely of the 129.09 low and the break above resistance at 130.44 confirmed that red wave ii has completed and red wave iii now is developing towards 135.74 and higher longer term. The next resistance to look for is seen at 131.71. Once broken the way higher to 135.74 should be right open. Support is now seen at 130.24 and again at 129.68. The later should be able to protect the downside for the expected test and break above 131.71. R3: 131.71 R2: 131.49 R1: 131.15 Pivot: 130.41 S1: 130.24 S2: 130.05 S3: 129.68 Trading recommendation: We are long EUR from 130.28 and we have placed our stop at 129.50. If you are not long EUR yet, then buy near 130.24 and use the same stop at 129.50. Read more: https://www.instaforex.com/forex_analysis/121273 |
Elliott wave analysis of EUR/JPY for July 31, 2018 https://forex-images.ifxdb.com/userfiles/20180731/analytics5b5fcde5d5bb8.png EUR/JPY found support near the 61.8% corrective target at 128.98 (the low was seen at 129.09). The following break above the channel resistance-line indicates that red wave ii has completed and red wave iii now is developing. To confirm this is the case, we still need a clear break above resistance at 130.44. A clear break above here will call for a rally towards 135.74. Support is now seen at 129.84 and again at 129.43. Ideally the later will protect the downside for a test and break above resistance at 130.44. R3: 130.74 R2: 130.44 R1: 130.10 Pivot: 129.84 S1: 129.43 S2: 129.09 S3: 128.55 Trading recommendation: We will buy EUR at 129.55 or upon a break above 130.28. Read more: https://www.instaforex.com/forex_analysis/121180 |
Elliott wave analysis of EUR/JPY for July 30, 2018 https://forex-images.ifxdb.com/userfiles/20180730/analytics5b5e7fe5157b9.png EUR/JPY remains lock inside the descending channel towards the 128.55 - 128.98 target area. Once this area is tested red wave ii is expected to complete and a new impulsive rally in red wave iii should take over for a rally towards 135.74. Short-term resistance is seen at 129.65 and again at 130.28. A break above the later will be a strong indication that red wave ii has completed and that red wave iii is developing. R3: 130.28 R2: 130.03 R1: 126.65 Pivot: 129.35 S1: 129.09 S2: 128.98 S3: 128.55 Trading recommendation: We will buy EUR at 128.60 or upon a break above 130.28. Read more: https://www.instaforex.com/forex_analysis/121091 |
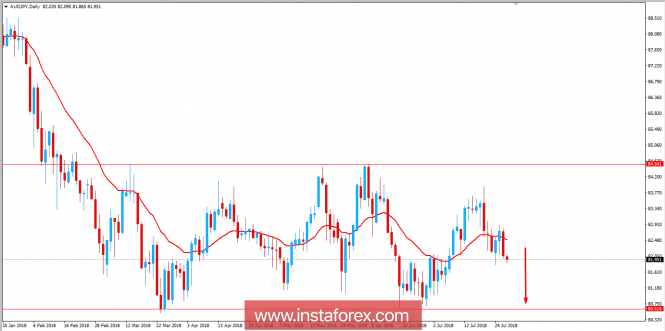
Fundamental Analysis of AUD/JPY for July 27, 2018 AUD/JPY has been residing inside the range between 80.50 to 84.50 for a few months now and currently, the price is expected to push lower towards the support area of 80.50 in the coming days. Despite the recent worse economic reports, JPY managed to maintain its momentum over AUD and expected to extend it further in the coming days. AUD has been performing quite well with the economic reports but failed to meet the stamina it needed for standing against the impulsive JPY gains in the process. Today AUD PPI report was published with a decrease to 0.3% which was expected to be unchanged at 0.5%. After the positive increase in AUD Import Prices to 3.2% from the previous value of 2.0%, today's economic report pushed the market to further indecision against JPY. On the JPY side, having a series of mixed economic reports this week, today JPY Tokyo Core CPI report was published with an increase to 0.8% which was expected to be unchanged at 0.7%. As of the current scenario, the indecision and corrective momentum is expected to continue further as the mixed economic reports on the both currency in the pair struggles. Though AUD has been quite positive earlier but JPY managed to maintain that positive attitude to sustain the gains it managed throughout the previous days of the market but the indecision and volatile is still expected to exist in the market until the range boundary is broken with a daily close. Now let us look at the technical view. The price is currently residing below the dynamic level of 20 EMA while residing below 84.50 area and a recent lower high in the process. Yesterday's bearish candle was quite powerful as it engulfed the previous bullish candles with an ease which also indicates upcoming bearish momentum in the process. As the price remains below 84.50 with a daily close, the bearish bias is expected to continue in this pair as the long-term trend is also bearish. SUPPORT: 80.50 RESISTANCE: 84.50 BIAS: BEARISH MOMENTUM: IMPULSIVE https://forex-images.ifxdb.com/userfiles/20180727/analytics5b5a8e08e94e2.png Read more: https://www.instaforex.com/forex_analysis/121018 |
Elliott wave analysis of EUR/NZD for July 26, 2018 https://forex-images.ifxdb.com/userfiles/20180726/analytics5b594039346cf.png The ongoing correction in red wave ii keeps pushing lower, but it must not break below the start of red wave i at 1.7116 as a break below here, will confirm that black wave ii still is in motion and is headed for support at 1.7066. If, however, the low of red wave i at 1.7116 stays untouched, as we expected, for a break above the channel resistance near 1.7199, that will call for red wave iii towards 1.7510 on the way towards the first long-term target at 1.8381. R3: 1.7305 R2: 1.7268 R1: 1.7199 Pivot: 1.7184 S1: 1.7165 S2: 1.7130 S3: 1.7116 Trading recommendation: We are long EUR from 1.7226 with our stop placed at 1.7110. If you are not long EUR yet, then buy a break above the channel-resistance at 1.7199 and use the same stop at 1.7110. Read more: https://www.instaforex.com/forex_analysis/120939 |
Elliott wave analysis of EUR/JPY for July 25, 2018 https://forex-images.ifxdb.com/userfiles/20180725/analytics5b57ea79e4503.png EUR/JPY has traded within a very narrow 47 pips band the last couple of days. We expect a bottoming process to be developing and it should just be a matter of time, before EUR/JPY breaks above resistance at 130.44 confirming that a bottom is in place for the red wave ii and that the red wave iii towards 133.60 is developing. That said, we also need to be aware, that as long as resistance at 130.44 is able to cap the upside, the possibility of a spike low persists. If such a spike is seen, it should be short-lived and will likely not move below 129.44. R3: 131.05 R2: 130.75 R1: 130.44 Pivot: 130.27 S1: 130.01 S2: 129.75 S3: 129.44 Trading recommendation: We will buy EUR upon a break above 130.44. Our stop will be placed 10 pips below the most recent low. Read more: https://www.instaforex.com/forex_analysis/120852 |
Four interim stages of InstaForex contests over Let's cheer the best traders in the following four contests: One Million Option, InsatForex Sniper, FX-1 Rally, and Lucky Trader. We warmly congratulate our heroes on excellent scores and wish other participants to find their names among winners of further stages. One Million Option One Million Option is an extremely popular contest with InstaForex. Every step gathers a large number of traders who are keen to face a challenge and compete for the title of the best options trader. In the latest step, the best score was achieved by Eugeny Pelipenko, a trader from Ukraine. Please be aware that the next stage is just around the corner: from July 30, 2018 until August 3, 2018. InstaForex Sniper This contest is tailor-made for the fastest and most accurate traders. In the latest tournament, trader from Hungary Csaba Gyula Nagy proved his excellent skills. Get ready for the next step of InstaForex Sniper which will be held from July 30, 2018 to August 3, 2018. FX-1 Rally QiangFang, a trader from China, was the best to cope with the whole distance of FX-1 Rally. He displayed remarkable trading and racing skills. We congratulate the winner on a stunning victory and wish our hero to confirm the title of the best racer in further stages. If you also long for a tough challenge and are ready to feel the thrill of a race, welcome to the starting line of FX-1 Rally! You can register and take part in the nearest tournament which will take place from 00:00 July 27, 2018 to 23:59 July 27, 2018. Lucky Trader Agile mind, prudence, and focus on success are the keys to the victory in the two-week Lucky Trader marathon. If you are capable of carrying out flawless trading for two weeks, you will have a chance to win this competition. Sergey Ivanovitch Rozhnov is a great example to follow. The nearest stage of the Lucky Trader contest will run from July 30, 2018 until August 3, 2018. |
Elliott wave analysis of EUR/NZD for July 24, 2018 https://forex-images.ifxdb.com/userfiles/20180724/analytics5b5697d84d79d.png We continue to look for more upside pressure through resistance at 1.7268 and more importantly through resistance at 1.7305, that calls for red wave iii towards 1.7505 on the way higher towards 1.8381. Support is now seen at 1.7206 and again at 1.7170. Ideally the later will be able to protect the downside for the expected break above 1.7268. R3: 1.7305 R2: 1.7268 R1: 1.7232 Pivot: 1.7208 S1: 1.7184 S2: 1.7164 S3: 1.7144 Trading recommendation: We are long EUR at 1.7226 with our stop placed at 1.7110. If you are not long EUR yet, then buy EUR upon a break above 1.7268 and start by using the same stop at 1.7110. Read more: https://www.instaforex.com/forex_analysis/120763 |
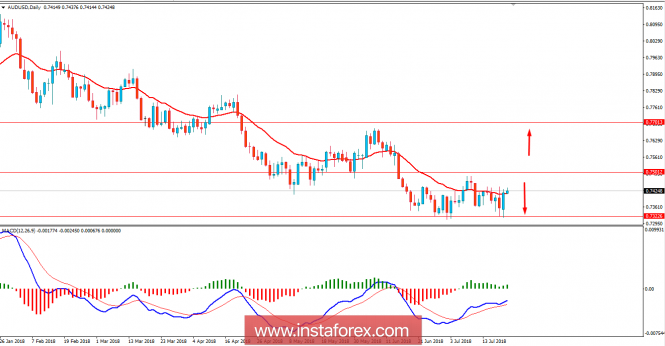
Fundamental Analysis of AUD/USD for July 23, 2018 AUD/USD has been quite corrective and volatile between the price range of 0.73 to 0.75 area which is still expected to push lower in the coming days as of the trend momentum. AUD has been quite positive with the recent gains against USD which is expected to last for short-term. Ahead of the high impact economic reports to be published on Thursday this week including CPI report which is expected to show an increase to 0.5% from the previous value of 0.4% and Trimmed Mean CPI report is expected to be unchanged at 0.5%. Today AUD CB Leading Index report is going to be published which previously was at 0.1% and expected to have an optimistic outcome. On the other hand, this week Core Durable Goods report is going to be published on Thursday which is expected to increase to 0.5% from the previous value of 0.0% and Average GDP report on Friday is expected to increase to 4.0% from the previous value of 2.0. Today Existing Home Sales report is going to be published which is expected to have a slight increase to 5.46M from the previous figure of 5.43M. As of the current scenario, both currencies in this pair are quite optimistic with the upcoming economic reports which might lead to further volatility in the pair but USD may have an upper hand over AUD having bigger gap in the forecasts with more optimism in the market sentiment. Now let us look at the technical view. The price has recently bounced off the 0.73 support area from where it might show certain bullish momentum but as the price remains below 0.75 the bearish bias is expected to continue and push the price lower towards 0.7050 in the coming days. On the other hand, a break above 0.75 with a daily close is expected to inject bullish momentum in the pair with target towards 0.77 area in the future. RESISTANCE: 0.75, 0.77 SUPPORT: 0.73, 0.7050 BIAS: BEARISH MOMENTUM: CORRECTIVE AND VOLATILE https://forex-images.ifxdb.com/userfiles/20180723/analytics5b555769d7d87.png Read more: https://www.instaforex.com/forex_analysis/120684 |
Elliott wave analysis of EUR/JPY for July 20, 2018 https://forex-images.ifxdb.com/userfiles/20180720/analytics5b51515741a3b.png EUR/JPY has dipped just below the target seen at 130.67 (the low has been seen at 130.59), this is enough to fulfill the red wave iv target and set the stage for a new impulsive rally higher in red wave v towards the 133.02 - 133.60 area. To confirm that red wave iv has completed, we need to see resistance at 131.50 be broken, which will confirm red wave v is building. This also means, that as long as this resistance is able to cap the upside, a deeper correction in red wave iv remains possible towards 130.18. R3: 131.98 R2: 131.50 R1: 131.22 Pivot: 130.59 S1: 130.18 S2: 129.88 S3: 129.59 Trading recommendation: We have bought EUR at 130.80 and we will place our stop at 129.80. If you are not long EUR yet, then buy a break above 131.22 or more conservative a break above 131.50 and start by using the same stop at 129.80. Read more: https://www.instaforex.com/forex_analysis/120600 |
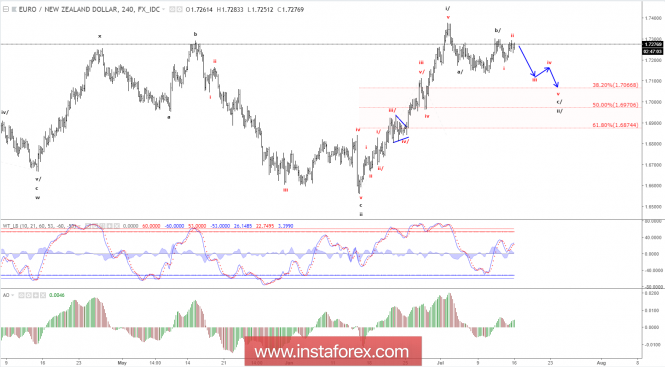
Elliott wave analysis of EUR/NZD for July 19, 2018 https://forex-images.ifxdb.com/userfiles/20180719/analytics5b50014e172a7.png The wave ii/ correction towards at least 1.7067 is developing as expected. Wave c/ of ii/ is most likely shaping up to be an ending diagonal, meaning that resistance should be expected near 1.7182 for the final leg lower to the corrective target at 1.7067 from where a new impulsive rally is expected. Only a direct break above resistance at 1.7236 will indicate a premature completion of wave c/ and ii/ for the next rally higher towards 1.7668 and 1.7979 as the next upside targets. R3: 1.7298 R2: 1.7236 R1: 1.7182 Pivot: 1.7136 S1: 1.7116 S2: 1.7067 S3: 1.7026 Trading recommendation: We will buy EUR at 1.7075 or upon a break above resistance at 1.7236 Read more: https://www.instaforex.com/forex_analysis/120522 |
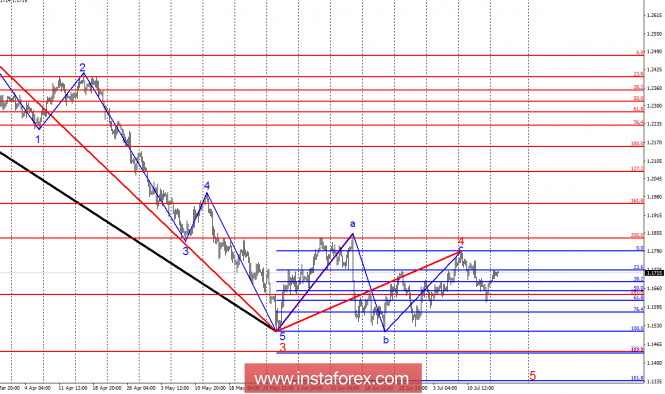
Wave analysis of EUR / USD pair for July 17. Meeting of leaders of the US and Russia did not affect the pair https://forex-images.ifxdb.com/userfiles/20180717/analytics5b4d9b38639b5.png Analysis of wave counting: During the Monday session, the EUR/USD pair gained about 20 bp, counting the close of the day. Thus, the pair remains within the framework of the proposed wave 5 of the downward trend section. If this is the case, then the construction of an internal correction wave in the future has begun. On this basis, the decline in quotations should resume in the near future. The absence of breakdown of the maximum wave 4, in 3, the maximum wave a, in 4 indicates the preservation of the downward sentiment in the foreign exchange market. A successful attempt to break through the high of July 9 will require us in refining the wave count. Goals for sales: 1.1510 - 100.0% by Fibonacci 1.1433 - 127.2% Fibonacci retracement Goals for shopping: 1.1866 - 100.0% Fibonacci retracements 1.2072 - 127.2% by Fibonacci General conclusions and trading recommendations: There is every reason to assume completion of the wave construction at 4th in c. Thus, it is recommended to continue selling the pair with the first targets near the estimated marks of 1.1510 and 1.1433, which corresponds to 100.0% and 127.2% of Fibonacci. Moreover, I recommend buying the pair only after a successful attempt to break the maximum of the assumed wave c at 4th. Then the pair can proceed to a more extensive formation of the ascending set of waves. Read more: https://www.instaforex.com/forex_analysis/209750 |
Hurry up to take part in Hyundai Sonata from InstaForex raffle! Only 2 days left till the end of the campaign! For a chance to become a participant you have to fulfill two simple requirements: 1. Deposit https://secure.instaforex.com/deposits?lang=enyour trading account at least $500; 2. Register; https://www.instaforex.com/sonata-reg Campaign open till July 20, 2018. Take part in campaign and win the main prize!
|
Elliott wave analysis of EUR/JPY for July 17, 2018 https://forex-images.ifxdb.com/userfiles/20180717/analytics5b4d5ca2502f7.png EUR/JPY is now testing the 161.8% extension target for red wave iii and a correction should be expected anytime towards 130.87 and maybe even closer to 130.59 in red wave iv, before red wave v will be ready to take over, for a continuation higher towards 133.49 and the ideal target for black wave iii/ at 137.68. Our preferred long-term count shows that a huge [B] wave triangle completed with the test of 124.59 and wave [C] to above 169.97 now is developing. As we still are in the very early stages of this [C] wave higher, the waves will be less clear, but as wave [C] builds it will become easier to extract the larger waves. R3: 132.54 R2: 132.11 R1: 131.63 Pivot: 131.41 S1: 131.24 S2: 131.08 S3: 130.87 Trading recommendation: We will use the coming correction in red wave iv to buy EUR. Ideally as close to 130.10 as possible. Read more: https://www.instaforex.com/forex_analysis/120367 |
Elliott wave analysis of EUR/NZD for July 16, 2018 https://forex-images.ifxdb.com/userfiles/20180716/analytics5b4c0f9f62a68.png Wave i/ peaked at 1.7479 and the ongoing correction in wave ii/ will ideally make it lower to the 38.2% support at 1.7067 before turning higher in wave iii/ towards 1.8638. Short-term a break below minor support at 1.7238 confirms more corrective downside pressure towards 1.7112 and ideally towards the 38.2% corrective target at 1.7067 to complete wave ii/ and set the stage for the next upside attack in wave iii/ towards 1.8638. R3: 1.7379 R2: 1.7320 R1: 1.7299 Pivot: 1.7238 S1: 1.7200 S2: 1.7181 S3: 1.7139 Trading recommendation: We will wait for a buying opportunity near 1.7067 Read more: https://www.instaforex.com/forex_analysis/120297 |
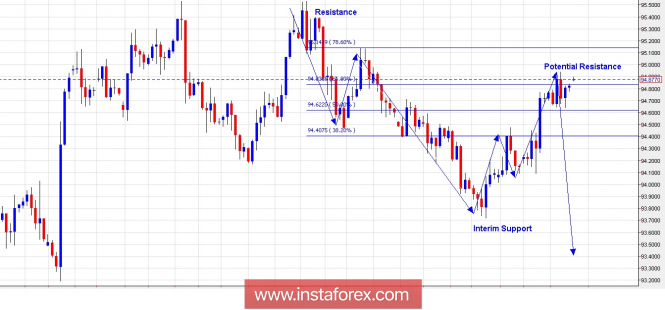
Trading Plan for US Dollar Index for July 13, 2018 https://forex-images.ifxdb.com/userfiles/20180713/analytics5b482d50c8081.jpg Technical outlook: The US Dollar Index is seen to be trading around the potential resistance zone at the 94.80/95.00 levels. Also please note the Fibonacci 0.618 resistance passing through the 94.85 levels as depicted here. A bearish turn seems to be the high probable move from here, bottom line prices should remain below the 95.50 levels for now. Also note that the US Dollar Index might be working on wave (4) of a higher degree and until prices stay above the 91/92 levels, the count remains valid. For now, bears should be back in control from around these levels and continue to drag prices below 93.80 at least. On the flip side, if resistance at 95.50 is taken off, it would mean that bulls are targeting the 98.00 levels before taking a meaningful correction. Trading plan: Remain short from here, stop above 95.50, target at 93.00. Fundamental Outlook: Watch out for USD U. Michigan at 1000 AM EST, followed by Fed Monetary Policy to Congress at 1100 AM EST. Good luck! Read more: https://www.instaforex.com/forex_analysis/120250 |
Names of another portion of winners unveiled Yet another InstaForex contest week has come to an end meaning it is time to name the winners. They are participants of the following contests: InstaForex Sniper, Lucky Trader, FX-1 Rally, and One Million Option. InstaForex offers all the winners its sincerest congratulations and wishes the rest contestants to win the upcoming competitions. InstaForex Sniper The most accurate and fastest traders compete fiercely in the InstaForex Sniper contest. This time, Pavel Gribovskiy from Belarus proved to be the best in this contest stage. The next step will be carried out from July 16, 2018 to July 20, 2018. Lucky Trader Confidence, prudence, and concentration on success are the key to success in two-week marathon Lucky Trader. If you manage to trade perfectly during two weeks, you will be able to win the Lucky Trader contest, just like Aleksandr Meshcheryakov did it. The next stage of the Lucky Trader contest will be held from July 23, 2018 to August 3, 2018. FX-1 Rally The best performance in the FX-1 Rally contest was demonstrated by Muzaffar Shamsiev from Uzbekistan. We congratulate the winner and wish him luck in next competitions. If you want to feel the thrilling spirit of this fight, welcome to the start of another stage of the FX-1 Rally contest. You can register for the nearest rally that will take place from 00:00 July 13, 2018 to 23:59 July 13, 2018. One Million Option One Million Option is one of the most popular InstaForex contests. Every step gathers hundreds of participants who vie with each other to prove themselves as excellent options traders. The best result was shown by Valeriy Kuzishin from Ukraine. The next contest is to start pretty soon, on July 16, 2018, and it will run till July 20, 2018. |
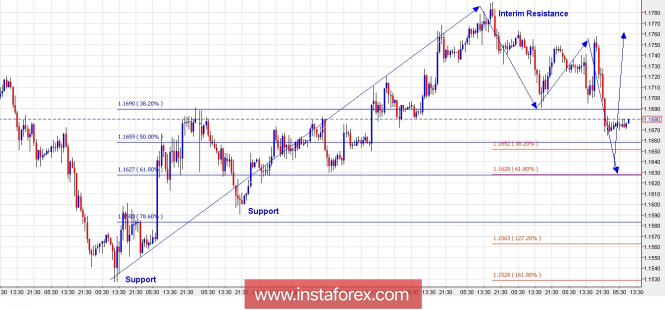
Trading Plan for EUR/USD for July 12, 2018 https://forex-images.ifxdb.com/userfiles/20180712/analytics5b46dbf50bea5.jpg Technical outlook: The hourly EUR/USD chart presented here indicates that the currency pair is dropping in a corrective manner since printing highs at the 1.1790 levels recently. At this point in time, prices are finding support at a past resistance turned support zone around the 1.1660/70 levels. According to the Fibonacci extensions displayed here, it remains quite possible for the pair to drop through the 1.1650/30 levels to find further support before turning higher. The price support is seen at the 1.1590 levels, followed by the 1.1530 levels, respectively, while interim resistance is seen at the 1.1790 levels. Most probable direction is to push higher at least one last time towards 1.1850 and above, before reversing lower again. Please note that in the medium term, till the prices remain below the 1.2150 levels, bears shall be in complete control. Trade plan: Aggressive traders, now look to buy again between the 1.1630/60 levels, with stop below 1.1550 and target above 1.1850. Fundamental outlook: Watch out for USD CPI at 0800 AM EST today. Good luck! Read more: https://www.instaforex.com/forex_analysis/120162 |
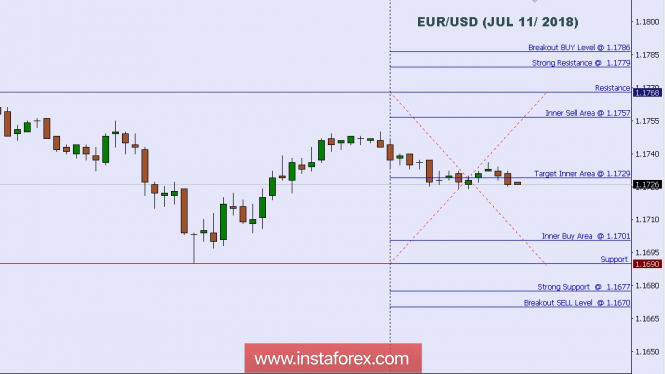
Technical analysis: Intraday Level For EUR/USD, July 11, 2018 https://forex-images.ifxdb.com/userfiles/20180711/analytics5b45803775857.jpg When the European market opens, some Economic Data will be released such as German 10-y Bond Auction. The US will also release the Economic Data such as Crude Oil Inventories, Final Wholesale Inventories m/m, PPI m/m, and Core PPI m/m, so amid the reports, EUR/USD will move in a low to medium volatility during this day. TODAY'S TECHNICAL LEVEL: Breakout BUY Level: 1.1786. Strong Resistance:1.1779. Original Resistance: 1.1768. Inner Sell Area: 1.1757. Target Inner Area: 1.1729. Inner Buy Area: 1.1701. Original Support: 1.1690. Strong Support: 1.1677. Breakout SELL Level: 1.1670. Disclaimer: Trading Forex (foreign exchange) on margin carries a high level of risk, and may not be suitable for all Traders or Investors. The high degree of leverage can work against you as well as for you. Before deciding to invest in foreign exchange you should carefully consider your investment objectives, level of experience, and risk appetite. The possibility exists that you could sustain a loss of some or all of your initial investment and therefore you should not invest money that you cannot afford to lose. You should be aware of all the risks associated with foreign exchange trading, and seek advice from an independent financial advisor if you have any doubts. Read more: https://www.instaforex.com/forex_analysis/120096 |
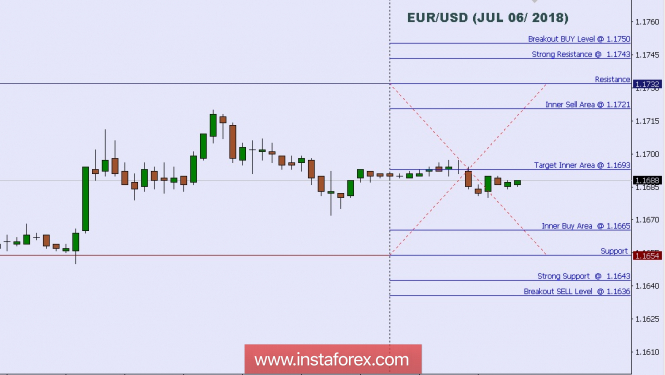
Technical analysis: Intraday Level For EUR/USD, July 06, 2018 https://forex-images.ifxdb.com/userfiles/20180706/analytics5b3ef145bf9d9.jpg When the European market opens, some Economic Data will be released such as Italian Retail Sales m/m, French Trade Balance, and German Industrial Production m/m. The US will release the Economic Data too, such as Natural Gas Storage, Trade Balance, Unemployment Rate, Non-Farm Employment Change, and Average Hourly Earnings m/m, so, amid the reports, EUR/USD will move in a medium to high volatility during this day. TODAY'S TECHNICAL LEVEL: Breakout BUY Level: 1.1750. Strong Resistance:1.1743. Original Resistance: 1.1732. Inner Sell Area: 1.1721. Target Inner Area: 1.1665. Inner Buy Area: 1.1633. Original Support: 1.1654. Strong Support: 1.1643. Breakout SELL Level: 1.1636 . Disclaimer: Trading Forex (foreign exchange) on margin carries a high level of risk, and may not be suitable for all Traders or Investors. The high degree of leverage can work against you as well as for you. Before deciding to invest in foreign exchange you should carefully consider your investment objectives, level of experience, and risk appetite. The possibility exists that you could sustain a loss of some or all of your initial investment and therefore you should not invest money that you cannot afford to lose. You should be aware of all the risks associated with foreign exchange trading, and seek advice from an independent financial advisor if you have any doubts. Read more: https://www.instaforex.com/forex_analysis/119876 |
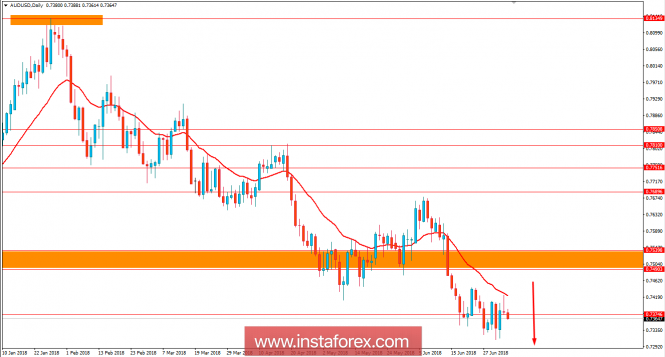
Fundamental Analysis of AUD/USD for July 5, 2018 AUD/USD has been quite impulsive with the bearish gains today after rejecting off the dynamic level of 20 EMA yesterday with a daily close. Whereas AUD has been struggling with the recent economic reports, Trade War tension has got into USD ahead of the upcoming NFP report this Friday. Recently AUD Retail Sales report was published with better than expected value at 0.4% decrease from the previous value of 0.5% but a slightly better than expectation of 0.3% and Trade Balance report failed to meet the expectation with the actual figure of 0.83B increasing from the previous figure of 0.47B which was expected to be at 1.21B. On the other hand, ahead of the NFP report tomorrow, today Challenger Job Cuts report is going to be published today which previous was at -4.8% with no expectation so far, ADP Non-Farm Employment Change report is expected to increase to 190k from the previous figure of 178k, Unemployment Claims is expected to decrease to 225k from the previous figure of 227k, Final Services PMI is expected to be unchanged at 56.5 and ISM Non-Manufacturing PMI report is expected to have slight decrease to 58.3 from the previous figure of 58.6. Moreover, today FOMC Meeting Minutes is going to be held which is expected to have a higher impact on the USD momentum this week. As of the current scenario, USD is expected to have an upper hand over AUD in the coming days despite the AUD mixed economic reports published recently. Though certain volatility may occur in the process market is still not anti USD biased by now for the Trade War for which certain gains may be observed on the USD side for the coming days. Now let us look at the technical view. The price is currently residing at the edge of 0.7350 area from where it is expected to push much lower towards 0.72 area in the coming days. The trend has been a bit non-volatile recently for which expected impulsive momentum is yet to be observed in the pair. As the price remains below the dynamic level of 20 EMA and 0.7500-50 area, the bearish bias is expected to continue further. NEAREST RESISTANCE: 0.7500-50 NEAREST SUPPORT: 0.7250 BIAS: BEARISH MOMENTUM: IMPULSIVE VOLATILE https://forex-images.ifxdb.com/userfiles/20180705/analytics5b3dadcc69733.png Read more: https://www.instaforex.com/forex_analysis/119803 |
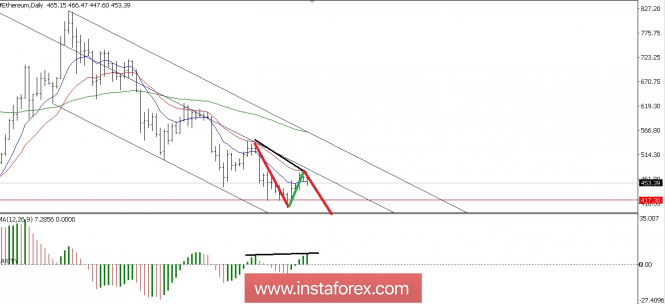
Technical analysis of Ethereum for July 04, 2018 https://forex-images.ifxdb.com/userfiles/20180704/analytics5b3c5122bf494.jpg The Ethereum at Daily Charts looks like still continuing its Bearish bias. This is already confirmed by the price moving in a down slope channel and we've spotted the hidden Divergence between the MACD Histogram and the price, so the tendency of this Cryptocurrency still continues its downtrend. (Disclaimer) *The market analysis posted here is meant to increase your awareness, but not to give instructions to make a trade. Read more: https://www.instaforex.com/forex_analysis/119730 |
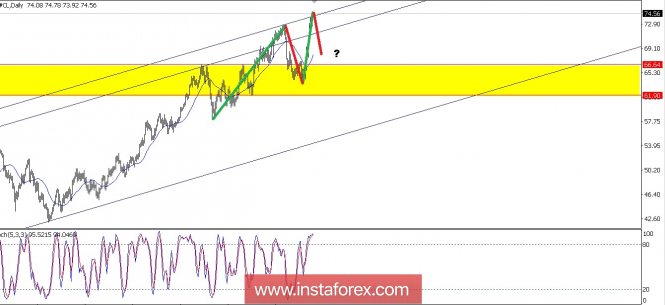
Technical analysis of Crude Oil for July 03, 2018 https://forex-images.ifxdb.com/userfiles/20180703/analytics5b3af67e5e895.jpg If we look at the Daily Charts, we will see that the Crude Oil bias is in a Bullish condition, but it seems already overbought this situation. The price is already at the top of the up channel and the Stochastic Oscillator is already at the overbought level too, basing on this fact in a few days ahead there is a possibility for the #CL to get a down correction to the Moving Average Period 21 or to the (RBS) Resistance Become Support Zone at 61.90-66.64 level. Read more: https://www.instaforex.com/forex_analysis/119658 |


