Instaforexbuk's Posts
Nairaland Forum › Instaforexbuk's Profile › Instaforexbuk's Posts
1 2 3 4 5 6 7 8 9 10 11 (of 19 pages)
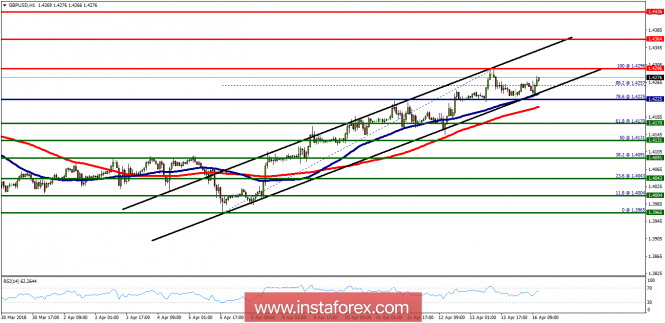
Technical analysis of GBP/USD for April 16, 2018 https://forex-images.ifxdb.com/userfiles/20180416/analytics5ad4684d01e3a.png Overview: The GBP/USD pair continues to trade upwards from the level of 1.4225 (the daily pivot point). Last week, the pair rose from the level of 1.4170 (the level of 1.4170 is coincided with the major support today) to the top around 1.4296. Today, the first resistance level is seen at 1.4364 followed by 1.4426, while daily support 1 is seen at 1.4170. According to the previous events, the GBP/USD pair is still moving between the levels of 1.4225 and 1.4364; for that we expect a range of 139 pips (1.4364 - 1.4225) at least in coming days. If the GBP/USD pair fails to break through the resistance level of 1.4364, the market will decline further to 1.4170. This would suggest a bearish market because the RSI indicator is still in a positive area and does not show any trend-reversal signs. The pair is expected to drop lower towards 1.4170 with a view to test the daily support. On the contrary, if a breakout takes place at the resistance level of 1.4364, then the trend will continue to move towards the next target of 1.4426. Read more: https://www.instaforex.com/forex_analysis/113367 |
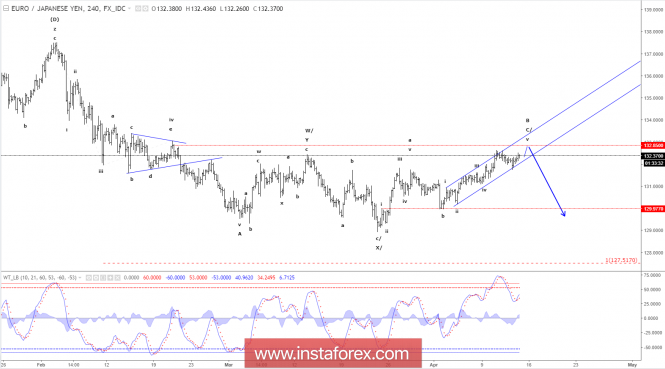
Elliott wave analysis of EUR/JPY for April 13, 2018 https://forex-images.ifxdb.com/userfiles/20180413/analytics5ad033b053bb9.png A final spike closer to 132.82 remains expected before renewed downside pressure is expected. Short-term, we will remain cautiously bullish for the spike to 132.82 as long as minor support at 131.75 is able to protect the downside, but from 132.82 or upon a break below minor support at 131.75 a new impulsive decline towards 128.93 and lower is expected. R3: 133.39 R2: 132.82 R1: 132.62 Pivot: 132.05 S1: 131.75 S2: 131.65 S3: 131.65 Trading recommendation: We are long EUR from 130.70. We will raise our stop+reverse to 131.70. Our take profit+reverse remains at 132.65 Read more: https://www.instaforex.com/forex_analysis/113213 |
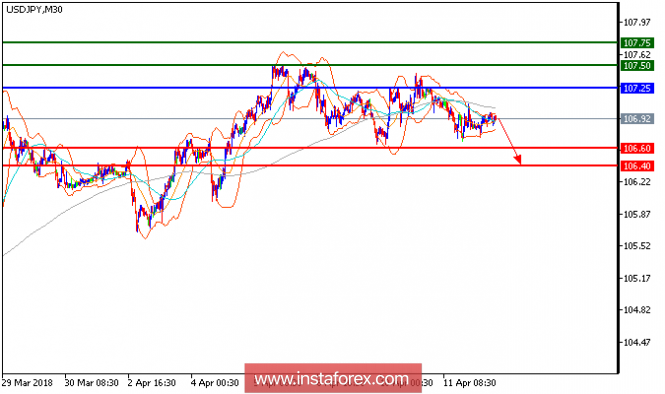
Technical analysis of USD/JPY for April 12, 2018 https://forex-images.ifxdb.com/userfiles/20180412/analytics5acf173901dcc.png USD/JPY is under pressure and expected to trade with bearish outlook. The pair retreated from 107.05 (the previous high) and broke below its 20-period moving average after touching the 50-period moving average. The relative strength index is below its neutrality level at 50 and lacks upward momentum. Hence, as long as 107.25 is not surpassed, look for a return to 106.60 (lows of April 9 and 10). A break below of this level would trigger another decline to 106.40. Chart Explanation: The black line shows the pivot point. The present price above the pivot point indicates a bullish position, and the price below the pivot point indicates a short position. The red lines show the support levels, and the green line indicates the resistance levels. These levels can be used to enter and exit trades. Strategy: SELL, stop loss at 107.25, take profit at 106.60 Resistance levels: 107.50, 107.75, and 108.00. Support levels: 106.60, 106.40, and 106.00. Read more: https://www.instaforex.com/forex_analysis/113141 |
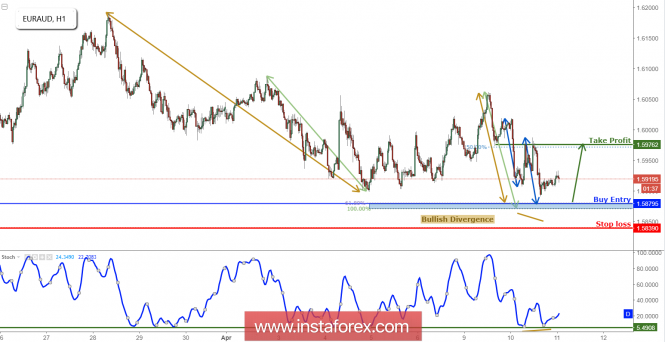
EUR/AUD Approaching Support, Prepare For A Bounce EUR/AUD is approaching its support area at 1.5879 (61.8% Fibonacci extension, 100% Fibonacci extension, horizontal swing low support) where we expect to see a bounce, pushing the price up all the way to its resistance at 1.5976 (50% Fibonacci retracement, horizontal overlap resistance). Stochastic (55, 5, 3) is approaching its support at 5.49% where we expect to see a corresponding bounce. A bullish divergence in price has also been identified which contributes to our bullish bias. Buy above 1.5879. Stop loss at 1.5839. Take profit at 1.5976. https://forex-images.ifxdb.com/userfiles/20180411/analytics5acd7574aee1e.png Read more: https://www.instaforex.com/forex_analysis/112986 |
Chancy Deposit: $5,000 only in April Dear traders! In honor of the victory of tennis player Daria Kasatkina in the semifinal of the Indian Wells Master tournament, we increased the bonus to $5 000 under the Chancy Deposit campaign in April. Now, if you replenish your account until April 30, you become a participant of the campaign and a contender to win of $5,000, which you can use in Forex trading. The Chancy Deposit contest is held monthly. Every time we change the bonus size. Follow our news and professional careers of our partners because every participant of the campaign has a chance to win the prize funds! https://forex-images.ifxdb.com/company_news/userfiles/chancy-april_en.jpg |
Wave analysis of the EUR/USD currency pair. Weekly review https://forex-images.ifxdb.com/userfiles/20180409/analytics5acb18356aef8.gif Analysis of wave counting: Trades of the past week the EUR/USD pair began with a slowly developing downward movement and, having lost in price more than 100 percentage point, reached the level of 1.2215 on Friday. The resulting wave situation makes it possible to assume that the currency pair has confirmed the transition to the stage of formation of the future wave c, in a, in B, in (C). If this is the case, then the currency pair has good prospects for lowering quotations to the level of the 21st figure, although on a more complex inclined direction. Targets for an upward wave option: 1.2400 Targets for a downward wave option: 1.2032 - 23.6% by Fibonacci 1.1709 - 38.2% by Fibonacci General conclusions and trading recommendations: The trading instrument supposedly completed the construction of the upward trend section. The wave b, in a, in B, in (C) is also supposedly completed. If this is true, and this wave does not take a more complicated form, then the quotes decrease will continue with the targets located near the estimated marks of 1.2032 and 1.1709, which corresponds to 23.6% and 38.2%. Read more: https://www.instaforex.com/forex_analysis/203026 |
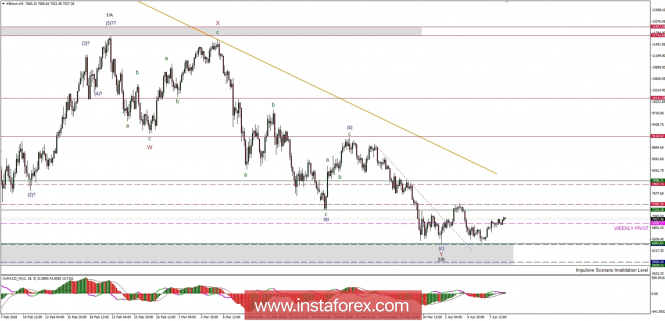
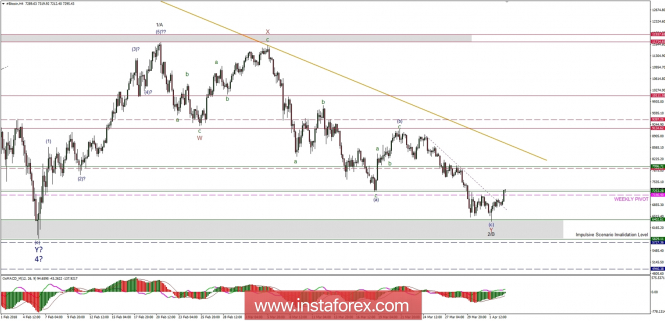
Bitcoin analysis for 09/04/2018 The Reserve Bank of India (RBI) announced in a statement on the development and regulatory policies, that it was considering issuing its own central bank digital currency (CBDC). RBI set up an inter-ministerial group to explore the potential benefits and feasibility of the CBDC, which will present its findings in the report in June 2018, the statement."Technological innovations, including virtual currencies, have the potential to improve the efficiency and integrity of the financial system." - said Bibhu Prasad Kanungo, deputy RBI governor. The information appeared despite the bank's earlier announcement that it prohibits all regulated entities from providing services to users, traders or holders of cryptocurrencies. The RBI position - a pro-state cryptocurrency and a decentralized cryptocurrency - represents a broader trend among international central banks. One of the solutions to potential problems of central banks, such as money laundering, is the co-optation of Blockchain technology by the institutions themselves, as Kanungo emphasized: "We are aware that Blockchain technology has potential benefits for the financial sector and we believe that it should be encouraged to use it for the benefit of the economy." Already in 2016, the Bank of England and the People's Bank of China analyzed the possibility of issuing their own digital currencies, together with over 90 central banks testing DLT technology in the same year. In 2017, the Bank of Canada published extensive research on the benefits of CBDC, and already in the first months of 2018, banks in Malaysia, Taiwan, Poland, and Switzerland, they conducted research on the use of Blockchain systems. Let's now take a look at the Bitcoin technical picture at the H4 time frame. The market is hovering around the weekly pivot at the level of $6,908 after the spike down towards the technical support at the level of $6,402 was unsuccessful. The nearest technical resistance is still seen at the level of $7,442, just above the weekly pivot resistance at the level of $7,333. The whole impulsive rally will get invalidated when the price will break through the level of $5,829. https://forex-images.ifxdb.com/userfiles/20180409/analytics5acb03af48be9.jpg Read more: https://www.instaforex.com/forex_analysis/112763 |
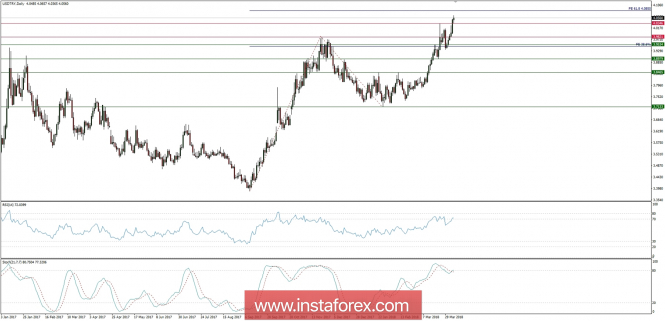
Global macro overview for 06/04/2018 On Friday morning, the US Dollar was valued at over 4.05 Turkish Lira. Previously, the USD/TRY exchange rate reached its historic maximum at 4.0657. Over the past 12 months, the Turkish currency has weakened against the dollar by 8.5 percent, and for three years lost as much as 36% of its value. Looking at the long-term chart, one can come to the conclusion that the Turkish currency is actually on a permanent downward trend. But it intensified after the unsuccessful military coup of July 2016. The attempted coup proved unsuccessful, and as a result, President Recep Tayyip Erdogan carried out purges in the state apparatus, education, and media, including practically the Sultan rule in Turkey. At the same time, the Turkish economy is facing serious structural problems. Although the GDP growth rate is 7.3% (in Q4) and it may be impressive, the country is struggling with serious macroeconomic imbalances. The first symptom is the rapidly growing current account deficit, which in January deepened to USD 7.1 billion against USD 2.7 billion a year earlier. This means that Turkish enterprises and households are getting heavily indebted abroad. Secondly, investors are worried by the price rally, which in March amounted to 10.23% towards 10.26%. in February. CPI inflation at double-digit level has been in Turkey for over a year. And there are not very clear views about anything that could be improved in the near future. The Turkish central bank remains under strong political pressure not to raise interest rates. Let's now take a look at the USD/TRY technical picture at the daily time frame. The market is still in the uptrend the recent high was made at the level of 4.0600. This might not be the end of the advance, as there is a Fibonacci extension target level located at 4.0850. The momentum remains strong, but first clues of a potential bearish divergence between the price and the momentum indicator are present. https://forex-images.ifxdb.com/userfiles/20180406/analytics5ac74992408ec.jpg Read more: https://www.instaforex.com/forex_analysis/112739 |
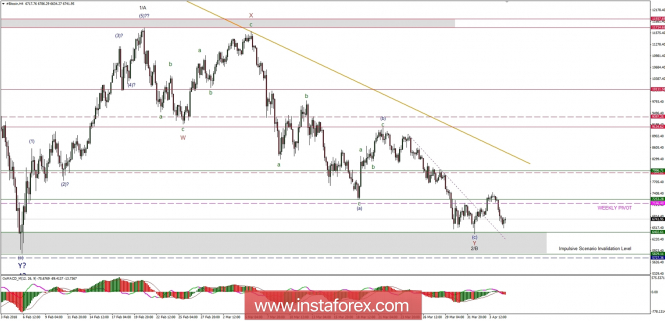
Bitcoin analysis for 05/04/2018 In the first quarter of 2018, cryptocurrency markets lost just over 48 percent of their value on January 1, and total capitalization dropped from around $ 612 billion to $ 261 billion in the first quarter. The Ripple Price (XRP) - one of the five largest cryptocurrencies listed on CoinMarketCap - fell by almost 78 percent, whose valuation unit is at $ 0.51, compared to January 1, at about $ 2.30. The second largest drop in terms of percentage is Bitcoin Cash (BCH), which lost about 73 percent of its value. In January, its price was around $ 2,543, today it is about $ 697. Litecoin (LTC) fell by about 49 percent from the price of January 1, when it cost about $ 231, where today it is around $ 118. The leading cryptocurrencies, Bitcoin and Ethereum, survived the worst first quarters since their inception. The price of Bitcoin fell by about 52 percent from January 1, when the price was around $ 14,122, to about $ 6,890 on March 31. ETH, which was sold at around $ 755 on January 1. It fell by about 48 percent, to around $ 394 on March 31. The fall in prices in all sectors can be attributed to the increase in regulatory regulation by various global entities, including the Securities and Exchange Commission (SEC), the control of Japanese unregistered cryptocurrency exchanges following the attack on Coincheck and Twitter, Facebook, and Google banning cryptography-related ads. Let's now take a look at the Bitcoin technical picture at the H4 time frame. Despite the initial breakout through the short-term descending trend line, the price was capped at the nearest technical resistance at the level of $7,500 and returned back to the local lows again. Any violation of the technical support at the level of $6,400 will lead to the test of the recent swing low at the level of $5,820. https://forex-images.ifxdb.com/userfiles/20180405/analytics5ac5d4f1afc08.jpg Read more: https://www.instaforex.com/forex_analysis/112587 |
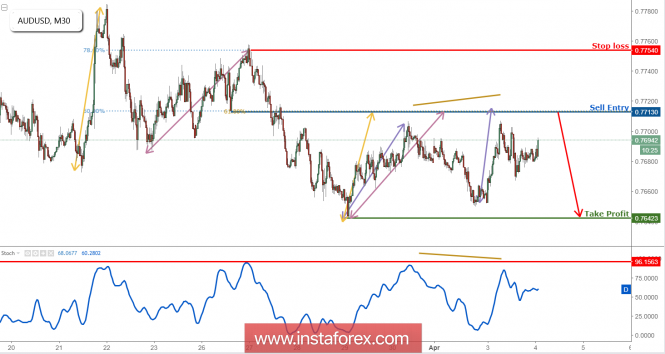
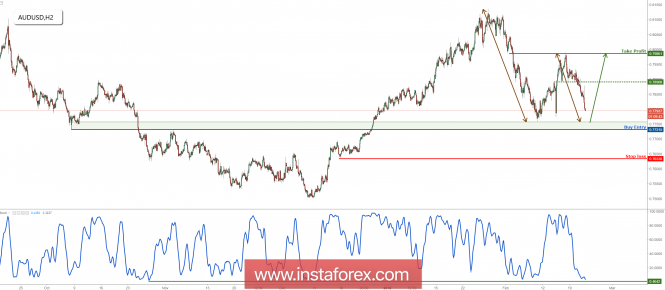
[B]AUD/USD Approaching Resistance, Lookout For a Reversal [/B] The price is approaching its major resistance at 0.7712 (61.8% Fibonacci extension, 100% Fibonacci extension, 100% Fibonacci extension, 50% Fibonacci retracement, 61.8% Fibonacci retracement, horizontal overlap resistance) where we expect a reversal, pushing price down to its support at 0.7642 (61.8% Fibonacci extension, horizontal swing low support). Stochastic (89, 5, 3) sees resistance at 96% where we expect a corresponding reversal. A bearish divergence with price has also been identified which adds to our bearish bias. Sell below 0.7712. Stop loss at 0.7754. Take profit at 0.7642. https://forex-images.ifxdb.com/userfiles/20180404/analytics5ac43a79a8709.png Read more: https://www.instaforex.com/forex_analysis/112437 |
Bitcoin analysis for 03/04/2018 During the meeting with the legislative arm of Taiwan, the head of the Central Bank, Yang Chin-long, was asked about how the banking authorities will respond to the current lack of transparency in the trade of cryptocurrencies in this country. The discussion was intensified mainly by recent price drops, in accordance with the news given by the Central Taiwan Agency. Answering the parliamentary MP's questions, the Governor of Taiwan said that the Central Bank has increased its efforts to monitor volatile movements of Bitcoin prices and will issue warnings to investors about the risk of cryptocurrency transactions. In addition, Yang said the banking body suggested to the Taiwanese Ministry of Justice that cryptocurrency transactions should be regulated in accordance with the applicable anti-money laundering (AML) regulations in the financial sector.The case remains open and it is not known whether the suggestion will be supported by the ministry, but it is to be the last move of the Taiwanese authorities in implementing BTC regulations. Earlier this month, the finance minister of the island, Sheu Yu-jer, expressed the belief that cryptocurrencies - which are treated like virtual goods - should be taxed in Taiwan. He added that the agency is currently investigating how to implement the appropriate taxation rules. Jang's comments appeared just after other Asian governments, such as South Korea and Malaysia, have already taken action to regulate cryptocurrencies under the anti-money laundering rules to prevent financial crimes. Let's now take a look at the Bitcoin technical picture at the H4 time frame. The market has bounced from the level of $6,400 and now is testing the technical resistance at the level of $7,245, just above the weekly pivot at the level of $7,146. the bounce from the level of $6,400 seems solid, so if the level of $7,245 is broken, then the bulls might push the price higher towards the level of $8,000. Bullish divergence supports the upward view. https://forex-images.ifxdb.com/userfiles/20180403/analytics5ac32f2ab4a6c.jpg Read more: https://www.instaforex.com/forex_analysis/112379 |
The results of four stages of contests from InstaForex are summed up The winners of four contests from InstaForex are determined. This time, we are ready to name the best of the best in the following contests: One Million Option, InstaForex Sniper, FX-1 Rally, and Lucky Trader. InstaForex congratulates the victors of the regular stages on excellent results and wishes other contestants to find their names in the next contest digests. One Million Option from InstaForex One Million Option is an extremely popular contest held by InstaForex. Every step gathers numerous participants who contest the title of the best options trader. Following the results of the regular stage of the contest, the best result was shown by Anatoly Yurevich Shevchenko. We would like to remind you that the next stage of One Million Option from InstaForex will be held very soon - from April 2, 2018 to April 6, 2018. InstaForex Sniper The keenest and fastest traders compete in the InstaForex Sniper contest. According to the results of the last stage of InstaForex Sniper, Alexander Anatolyevich Nefyodov turned out to be the best. Remember that the next stage of the InstaForex Sniper contest will be held from April 2, 2018 to April 6, 2018. Lucky Trader Steady hand, cool head, and concentration on success are the foundation for victories and perfect results in the two-week Lucky Trader marathon. If you are able to spend two trading weeks perfectly within the framework of the Lucky Trader contest, as Alexander Nikolayevich Remenyuk managed to do, you will also get a chance to become a winner of one of the stages. Remember that the next stage of the contest will be held from April 2, 2018 to April 13, 2018. FX-1 Rally The best performance during the regular stage of FX-1 Rally was shown by Jalpinkumar V Khira, a trader from India, who was able to demonstrate his outstanding trading and racing qualities. We congratulate the winner on the excellent performance and wish him to confirm his reputation of the best pilot in the next stages of the FX-1 Rally contest. If you need close-fought battle and you are ready to take part in a breathtaking race to the top, then welcome to the start of a regular stage of FX-1 Rally! You can register and participate in the next race that will be held from 00:00 April 6, 2018 to 23:59 April 6, 2018. |
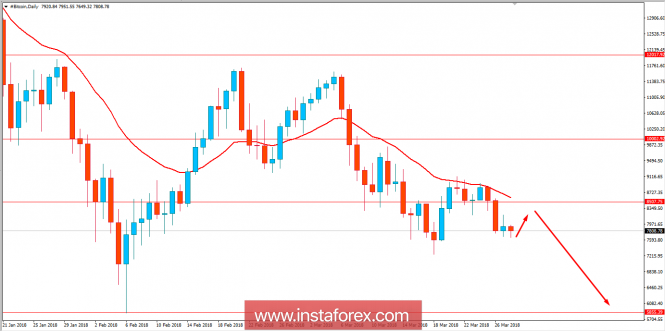
BITCOIN Analysis for March 28, 2018 Bitcoin has been quite indecisive recently having a daily candle close with a bullish gain below $8,500 price area. There have been no high impact fundamentals on Bitcoin recently. As a result, the price is now going through a corrective phase with indecision. The Bitcoin market is currently marked with low liquidity and expected to correct itself for a while before it pushes much lower in the coming days. There are watchdogs which are still trying to regulate the Bitcoin and some countries are banning the Bitcoin exchanges and trading. However, the sustainability of Bitcoin provides an indication of its strength against all the odds in the market currently. As for the current scenario, the price is expected to retest $8,500 price area before it progresses much lower towards $7,500 and later towards $5,500 in the short term. The impulsive bearish pressure can be only observed after $7,500 price area is taken out with a daily close in the coming days. Otherwise, the market is expected to consolidate between $7,500 to $8,500 area. https://forex-images.ifxdb.com/userfiles/20180328/analytics5abb35132f4d9.png Read more: https://www.instaforex.com/forex_analysis/112093 |
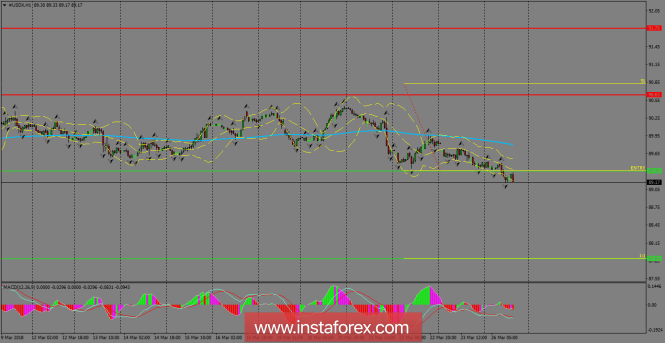
Daily analysis of USDX for March 27, 2018 The index remains under pressure below the 200 SMA at the H1 chart and the support zone of 89.36 is now being pierced, allowing for more losses in the short-term. There are fractals in formation which supports the bearish scenario for the coming days. USDX could be looking to test the 87.88 level and the MACD indicator is favoring to that scenario, as it stays in the negative territory. https://forex-images.ifxdb.com/userfiles/20180326/analytics5ab943b44bab2.png H1 chart's resistance levels: 90.63 / 91.75 H1 chart's support levels: 89.36 / 87.88 Trading recommendations for today: Based on the H1 chart, place sell (short) orders only if the USD Index breaks with a bearish candlestick; the support level is at 89.36, take profit is at 87.88 and stop loss is at 90.81. Read more: https://www.instaforex.com/forex_analysis/112009 |
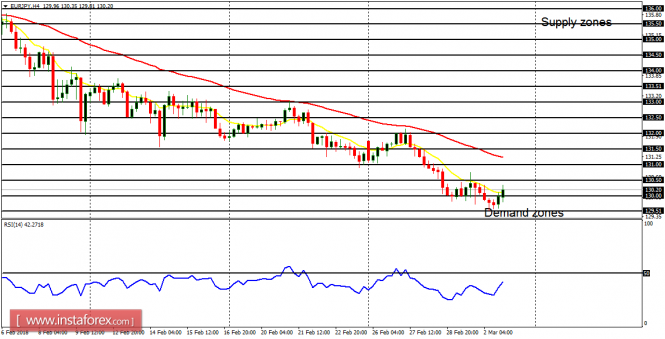
Daily analysis of EUR/JPY for March 26, 2018 EUR/JPY The conditions in the market is quite choppy. Although the market is choppy, the bearish trend has been maintained.Price has been going southward since February 5, having lost almost 800 pips since then. Last week, there was a rally attempt in the context of an uptrend, which was halted once the supply zone at 131.50 had been tested. Further upward movement was effectively prevented. The market shed 250 pips following that, to test the demand zone at 129.00, and closed below the supply zone at 129.50. The expected weakness in EUR, as well as the bearish outlook on the market, may enable the demand zones at 129.00, 128.50, and 128.00 to be tested this week. Read more: https://www.instaforex.com/forex_analysis/111959
|
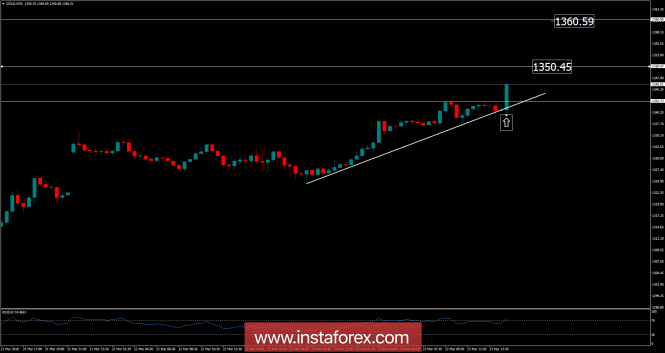
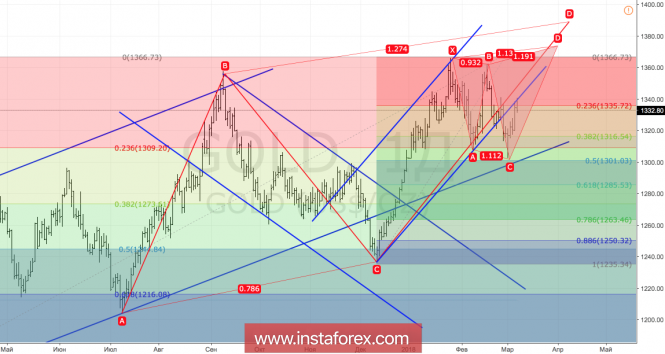
Analysis of Gold for March 23, 2018 https://forex-images.ifxdb.com/userfiles/20180323/analytics5ab4f33c4d26b.png Recently, Gold has been trading upwards. The price tested the level of $1,346.97. According to the 30M time – frame, I found a breakout of yesterday's high in the background, which is a sign that buyers are in control. I also found a successful rejection of the upward trendline, which is another sign of strength. My advice is to watch for potential selling opportunities. The upward targets are set at the price of $1,350.45 and at the price of $1,360.60. Resistance levels: R1: $1,334.27 R2: $1,339.62 R3: $1,344.35 Support levels: S1: $1,324.20 S2: $1,319.46 S3: $1,314.10 Trading recommendations for today: watch for potential buying opportunities. Read more: https://www.instaforex.com/forex_analysis/111937 |
Daria Kasatkina: hard way to top 10 For over 30 years, a small US town of Indian Wells with population of just 5,000 people turns into a tennis hub where all sports celebrities gather every March. The grand Indian Wells Masters tournament, that took place on March 7-18 this year, has the Premier Mandatory status. Such status is considered to be the most prestigious after the Grand Slam and the Final tournament of the year. For our company, the Indian Wells Masters 2018 is a particularly important event as Daria Kasatkina, the brilliant young tennis player and brand ambassador for InstaForex, took part at the tournament. We expected some great results from Daria, as she managed to beat four top-10 tennis players in the past few months. However, we could not even imagine that she would demonstrate such tremendous performance. Daria has defeated three top-15 tennis players in a row, paving the way for the semi-final where she competed with Venus Williams, the legend of the world tennis and holder of 49 titles in the singles category. The US athlete, being almost two times older, more experienced and rated higher than Daria, was obviously determined to win the game. The competition was really tough and exciting. As a result, Kasatkina secured a victory with the score of 4:6, 6:4, 7:5. Thus, she qualified for the final of Indian Wells Masters 2018. The tournaments' final caused a sensation, as it featured two young and ambitions sports talents. We have said a lot about Daria's achievements, and as for her opponent, 20-years old Japanese Naomi Osaka showed her potential in the very first game of the tournament beating the tennis star Maria Sharapova. Interestingly, two days before the tournament, Daria posted a video where she teaches Naomi how to hit a tweener, one of the most spectacular and difficult tennis shots. Daria's ability to strike tweeners has already impressed the global sports community. Having qualified to the final of Indian Wells Masters 2018, Daria has earned the 11th place in the WTA rating which means that she is world No. 11 in tennis and the top seed of Russia. In case of victory in the final, Daria would have made it into the top 10, reaching the 9th place. However Osaka secured a victory in straight sets: 6:3, 6:2. Nevertheless, we are sure that Kasatkina's spirit is strong enough to withstand this failure and to the contrary, it will give her confidence and strength for grand victories in the future. Meanwhile, qualifying for the Indian Wells Masters final is a great achievement that has already etched the name of Daria Kasatkina into the history of the world tennis. There are a lot of tournaments ahead, and we sincerely wish Daria sparkling and undoubted wins! [img]https://forex-images.ifxdb.com/company_news/userfiles/Daria-Kasatkina_foto2+logo_30%20(1).jpg[/img] |
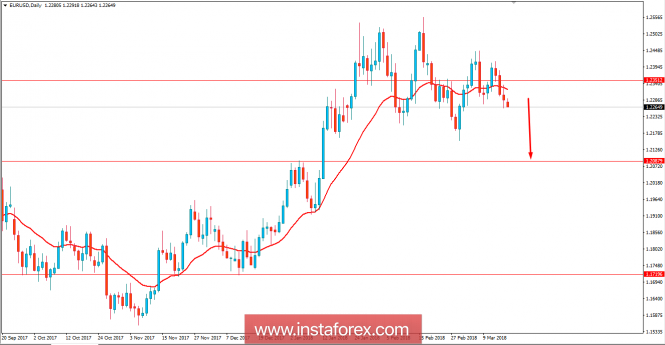
Fundamental analysis of EUR/USD for March 19, 2018 EUR/USD has been quite impulsive with the bearish pressure breaking below 1.2350 with a daily close. Ahead of the upcoming Fed rate decision which can result in a hike from 1.50% to 1.75%, the impulsive gain on the USD side is quite impressive and explains the current sentiment on the market. EUR has been quite neutral with the economic reports having no strong element to support its gain ahead of the rate hike this week. Today, the Italian Industrial Production report is going to be published which is expected to decrease to -0.5% from the previous value of 1.6%. Besides, the Italian Trade Balance report is expected to decrease to 4.87B from the previous figure of 5.25B and the trade balance report is expected to show a decrease to 22.6B from the previous figure of 23.8B. Moreover, today G20 Meeting is going to be held which is expected to inject good amount of volatility in the market for the whole day. The German Buba Monthly Report is also going to be published which is expected to be quite neutral in nature and will unlikely provide support to EUR. On the other hand, today USD FOMC Member Bostic is going to speak about Interest Rates and Monetary Policies which is expected to help USD gain some momentum ahead of the possible rate hike on Wednesday. As of the current scenario, USD is expected to gain momentum against EUR in the coming days whereas EUR may struggle to keep its grounds leading to impulsive bearish pressure in the pair. Now let us look at the technical view. The price is currently residing below 1.2350 with a daily close and having dynamic level of 20 EMA working as a resistance as well. Ahead of the upcoming rate hike, USD is expected to gain further momentum towards 1.2080 and later towards 1.1720 support area in the coming days. As the price remains below 1.2350 with a daily close, further bearish pressure is expected in this pair. https://forex-images.ifxdb.com/userfiles/20180319/analytics5aaf80075a677.png Read more: https://www.instaforex.com/forex_analysis/111761 |
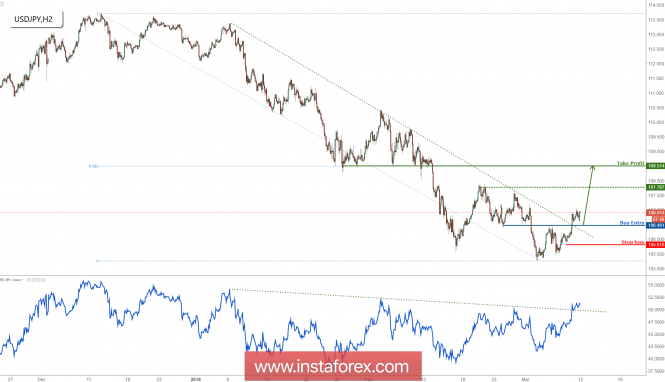
USD/JPY has reached our profit target perfectly, prepare for further rise The price has risen perfectly to our profit target and looks poised to rise further after breaking a strong descending resistance-turned-support line. We look to buy above 106.48 (Fibonacci retracement, horizontal overlap support, breakout level) for a push up to 108.51 (Fibonacci retracement, horizontal pullback resistance). We do have to be cautious about 107.78 resistance as the price might react off that level. RSI (89) has made a similar bullish exit signaling a change in momentum from bearish to bullish. Buy above 106.48. Stop loss at 105.81. Take profit at 108.51. https://forex-images.ifxdb.com/userfiles/20180312/analytics5aa5f6bb613e3.png |
Daily analysis of USD/JPY for March 9, 2018 USD/JPY There is a growing challenge to the recent bearish bias on the market. Since the demand level at 105.50 was tested, the market has gained 130 pips. Price is now above the demand level at 106.50, going towards the supply level at 107.00. There is a possibility of a change in the market bias when price goes further northwards. https://forex-images.ifxdb.com/userfiles/20180309/2.png The long-term bias is bearish. The EMA 11 is below the EMA 56, and the RSI period 14 is slightly below the level 50. There is currently a Bearish Confirmation Pattern on the 4-hour chart, but that will be overturned once the supply level at 107.50 is breached to the upside. Read more: https://www.instaforex.com/forex_analysis/111542 |
InstaForex congratulates all ladies! We sincerely congratulate all charming girls and pretty women on the International Women's Day! We wish you great and small professional successes, family warmth, loyal men, and true happiness! Let every day bring you bright emotions, joy, and content - from successful trading in the forex market, in particular. The InstaForex team promises to remain a reliable support for you. Let your life be full of pleasant events and let all your wishes and dreams certainly come true. May optimism, faith, and love guide your life. We wish you success, enthusiasm, cheerfulness, and vernal mood after prolonged winter! Happy holiday, dear women! https://forex-images.ifxdb.com/company_news/userfiles/8_march_2018_510x350_5.jpg |
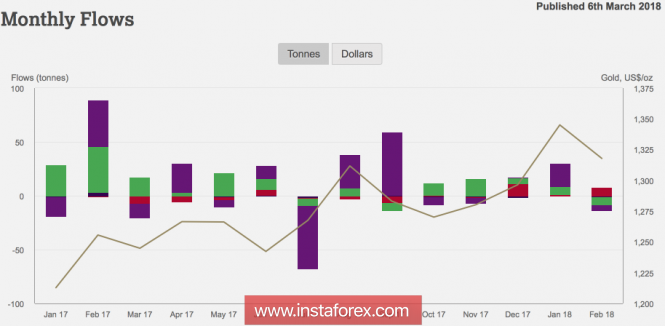
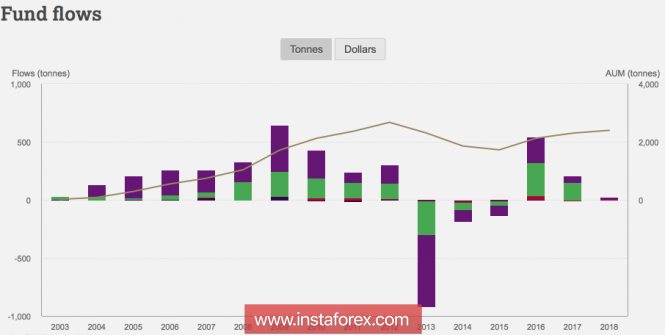
Gold was trapped The news about the resignation of the chief economic adviser to the president Gary Cohn allowed gold to mark its best daily level since Valentine's Day. If an ardent opponent of protectionism, an ex-candidate for the presidency of the Fed, withdraws from his post, a potential global trade war is unlikely to be avoided. And in it, all weapons will look good. Including - large-scale selling of US Treasury bonds by the main holders in the face of China and Japan. I believe other countries will do the same. Their desire to get rid of the power of the dollar will force them to shift to gold. Thus, trade wars are potentially capable of providing the precious metal with invaluable support. Until March, investors' demand for ETF products was characterized by mixed dynamics. The fall in the XAU/USD and the increase in gold volatility contributed to an outflow of 5.1 tonnes in February. The biggest losses were suffered by European (-7.3 tons) and North American stock-exchange specialized funds (-5.1 tons), while Asians, on the contrary, replenished their reserves (+7.9 tons). As a result, according to the latest figure, it has increased by 10% since the beginning of the year. Monthly dynamics of demand for ETF products https://forex-images.ifxdb.com/userfiles/20180307/analytics5a9fcefbef8dd.png Source: WGC. Annual dynamics of demand for ETF products https://forex-images.ifxdb.com/userfiles/20180307/analytics5a9fcf062a3dc.png Source: WGC. In my opinion, the value of the investment demand for precious metals was influenced by the strengthening of the US dollar. The fastest growth in the weekly wage in January over the past few years has strengthened the risks of overclocking inflation and the aggressive monetary tightening of the Fed. Moreover, the new head of the Federal Reserve was optimistic about the US economy and the way of betting on federal funds. The President of the Federal Reserve Bank of New York, William Dudley, indicated four hikes in 2018 - a gradual normalization of monetary policy. As a result, the futures market increased the chances of such an outcome to 34%, and gold plunged into a wave of selling. Everyone remembers perfectly how uncomfortable it felt at the eve of the historic FOMC meetings in 2017. Nevertheless, the growing likelihood of the implementation of the policy of anti-globalization, Donald Trump, significantly tempered investors' appetite for risk. If the stock indexes behaved rather restrained in response to the high-sounding statements of the US president on tariffs on the import of steel and aluminum, the resignation of Gary Cohn convinced that the matter should be taken very seriously. In the medium term, gold can be trapped in consolidation: on the one hand, news about the trade war will provide support to the bulls on the XAU/USD; on the other hand, the return of the divergence idea in the monetary policy of the Federal Reserve and the central banks-peers can become a saving straw for the US dollar. In my opinion, in the second and third quarters, against the background of the return of the normalization theme, its strength will run out, so the price will drop to the lower border of the trading range of $1300-1360 per ounce, which makes sense to use for purchases. Technically, if the bulls manage to return gold quotes to the limits of the upward medium-term trading channel, then the risks of implementing the target values by 113% and by 127.2% according to the Shark and AB = CD patterns will increase. Gold, daily chart https://forex-images.ifxdb.com/userfiles/20180307/analytics5a9fcf1333dab.png Read more: https://www.instaforex.com/forex_analysis/201237 |
Fundamental Analysis of USD/CAD for March 7, 2018 USDCAD has been extremely volatile and indecisive recently after breaking above 1.29 price area with a daily close. The price is still struggling to make a definite trend move in this pair which is currently expected to proceed higher in the coming days. The economic calendar contains a series of high impact economic reports from the US such as Non-Farm Employment Change, Unemployment Rate, and Average Hourly Earnings which are expected to show optimistic readings. Today ADP Non-Farm Employment Change report is going to be published which is expected to decrease to 199k from the previous figure of 234k, FOMC Members Bostic and Dudley are going to speak today about the nearest interest rate hike this month along with future monetary policies, investors expect to detect the hawkish stance in their comments. Market participants are currently quite biased with the US reports ahead of the upcoming Rate Hike this month. On the CAD side, there are high impact economic reports too. Today, Canada's Overnight Rate decision is going to be published which is expected to be unchanged at 1.25% along with BOC Rate Statement expected to be quite neutral today. Moreover, this week on Friday, Canada's Employment Change report is going to be published which is expected to show a significant increase to 21.8k from the previous negative figure of -88.0k and Unemployment Rate is expected to be unchanged at 5.9%. To sum up, this week the USD/CAD pair is likely to be highly volatile and indecisive until the weekly close on Friday but USD is expected to have an upper hand over CAD in the hsort term in light of the upcoming economic reports and events on the USD side this month. Now let us look at the technical view. The price is currently residing above 1.29 price area, affected by impulsive bearish pressure yesterday that leding to a daily close below it. The market is currently quite indecisive ahead of the upcoming high impact economic reports and events from the US and Canada. As for the current scenario, the price is expected to trade with a bullish biased as it remains above 1.29 with a daily close which is more probable until price breaks below the 1.29 price area with a daily close. https://forex-images.ifxdb.com/userfiles/20180307/analytics5a9f873ee2152.png Read more: https://www.instaforex.com/forex_analysis/111344 |
Fundamental Analysis of USD/JPY for March 6, 2018 USD/JPY has been quite impulsive with the bullish gains recently after bouncing off the important support area of 105.50. JPY has been quite positive with the recent economic reports like significant decrease in Unemployment Rate from 2.8% to 2.4%, which made the currency to gain significant momentum along the way against USD. Ahead of the upcoming high impact economic reports on the USD side this week and probable Interest Rate Hike this month, USD is currently recovering quite well from the impulsive JPY strike. Today, USD Factory Orders report is going to be published which is expected to decrease to -0.4% from the previous positive value of 1.7%, and IBD/TIPP Economic Optimism report is expected to increase to 58.2 from the previous figure of 56.7. Ahead of the upcoming Non-Farm Employment Change, Average Hourly Earnings, and Unemployment Rate report, USD is expected to gain certain momentum which may lead to further bullish pressure in the pair. Today, we do not have any JPY economic report to impact the market but on Thursday, JPY Bank Lending report is going to be published which is expected to be unchanged at 2.4%, Current Account is expected to increase to 1.76T from the previous figure of 1.48T, Final GDP Price Index is expected to be unchanged at 0.0%, and Final GDP is expected to increase to 0.2% from the previous value of 0.1%. As of the current scenario, this week the market is expected to be quite volatile whereas a number of high impact economic reports on the both sides are expected to inject uncertainty for the time being. To sum up, ahead of the upcoming economic reports, USD is expected to gain and sustain the bullish momentum in the pair if the economic reports are published better than expected by Friday daily close. Now let us look at the technical view. The price has been quite impulsive with the gains yesterday having bouncing off the 105.50 price area. The bearish trend has been quite non-volatile whereas certain retracement towards the 20 EMA and 107.30-50 area is expected before the price continues its bearish pressure in the coming days. As the price remains below the 108.50 price area, the bearish bias is expected to continue further. https://forex-images.ifxdb.com/userfiles/20180306/analytics5a9e3868022cc.png Read more: https://www.instaforex.com/forex_analysis/111225 |
Daily analysis of EUR/JPY for March 5, 2018 EUR/JPY This cross pair is a weak market. It is interesting to see the market is engaged in a long, protracted bearish movement. Since the beginning of February, at least, 700 pups have been shed. In the past few weeks, short-term rallies have been invariably followed by further southwards movements. https://forex-images.ifxdb.com/userfiles/20180305/3.png There is currently a Bearish Confirmation Pattern in the market. The price would continue moving downwards towards the demand zones at 130.00, 129.50 and 129.00. Nonetheless, a strong rally is in the offing, as the outlook on EUR pairs is bullish for this week. Read more: https://www.instaforex.com/forex_analysis/111090 |
Technical analysis of GBP/JPY for February 28, 2018 https://forex-images.ifxdb.com/userfiles/20180228/GBPJPYM30.png GBP/JPY is under pressure. The pair is clearly turning down, and is also under pressure below its horizontal level at 149.60. A bearish cross has been identified between the 20-period and 50-period moving averages, which should confirm a negative outlook. In which case, as long as the resistance at 149.60 is not surpassed, the risk of the break below 148.50 remains high. Alternatively, if the price moves in the direction opposite to the forecast, a long position is recommended to be above 149.60 with the target at 150.00. Strategy: SELL, Stop loss at 149.60, Take profit at 148.50 Chart Explanation: The black line shows the pivot point. The price above the pivot point indicates long positions; and when it is below the pivot point, it indicates short positions. The red lines show the support levels, and the green line indicates the resistance levels. These levels can be used to enter and exit trades. Resistance levels: 150.00, 150.50, and 151.00 Support levels: 148.50, 147.95, and 147.50 Read more: https://www.instaforex.com/forex_analysis/110766 |
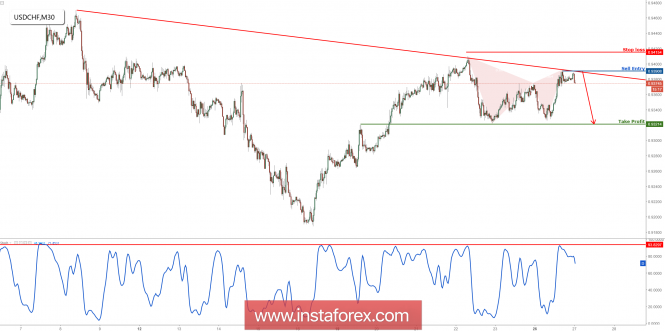
USD/CHF is testing strong resistance, it's time to start selling Price is testing major resistance at 0.9390 (Fibonacci extension, bearish harmonic formation, descending resistance) and a strong reaction could occur at this level to push the price down to the 0.9321 support (Fibonacci retracement, horizontal overlap support). Stochastic (34,5,3) is seeing major resistance at 93% where a corresponding reaction could occur. Sell below 0.9390. Stop loss at 0.9415. Take profit at 0.9321. https://forex-images.ifxdb.com/userfiles/20180227/analytics5a94bbe33df18.png Read more: https://www.instaforex.com/forex_analysis/110620 |
Technical analysis of EUR/USD for February 26, 2018 https://forex-images.ifxdb.com/userfiles/20180226/EURUSDH1.png Overview: The trend of the EUR/USD pair movement was controversial as it took place in a narrow sideways channel, the market showed signs of instability. Amid the previous events, the price is still moving between the levels of 1.2259 and 1.2373. Also, the daily resistance and support are seen at the levels of 1.2408 and 1.2442, respectively. Therefore, it is recommended to be cautious while placing orders in this area. So, we need to wait until the sideways channel has completed. Last week, the market moved from its bottom at 1.2260 and continued to rise towards the top of 1.2352. Today, in the one-hour chart, the current rise will remain within a framework of correction. However, if the pair fails to pass through the level of 1.2404, the market will indicate a bearish opportunity below the strong resistance level of 1.2404. Since there is nothing new in this market, it is not bullish yet. Sell deals are recommended below the level of 1.2404 with the first target at 1.2295. If the trend breaks the support level of 1.2295, the pair is likely to move downwards continuing the development of a bearish trend to the level 1.2260 in order to test the double bottom again. Read more: https://www.instaforex.com/forex_analysis/110582 |
The trade review for February 23 by simplified wave analysis Overview and Outlook for #USDX (US Dollar Index) As shown in the graph of the American currency index, the formation of an extended downward plane continued during the last three years. Since the beginning of last year, the final part of the wave model started. The structure of the entire wave does not show completeness. The strong level of support reached by the quotes triggered the formation of a corrective zone, in the form of a flat. The expected growth potential is limited by the determined resistance zone. Today, the completion of the bearish retracement that began yesterday is expected. The lower zone is the support level. A short-term gap of the lower boundary is not excluded. A reversal through the upward movement can be expected in the afternoon. Boundaries of resistance zones: - 90.50 / 60 Boundaries of support zones: - 89.70 / 60 https://forex-images.ifxdb.com/userfiles/20180223/analytics5a8fa7823771e.jpg Review and Forecast for NZD / USD The last wave of the daily chart of the major currency "Kiwi" dollar in September 2016 brought the pair's price into the zone of a strong resistance line. Over the next year and a half, the price formed a correction in a wide flat corridor. As of now, the correctional structure has been completely completed and its entire parts have been formed. For today, the last and incomplete ascending part have a reversal potential. The first part of the wave (A) is complete. Since January 24, a flat correction zigzag (B) began to form. Due to the impulsive nature of the bullish wave that has started, we can expect a minimum possible reduction. During the next trading sessions, the following events are expected such as the completion of the downward rollback, the reversal formation and the beginning of the ascending phase of the pair's movement. Boundaries of resistance zones: - 0.7250 / 80 Boundaries of support zones: - 0.7270 / 40 https://forex-images.ifxdb.com/userfiles/20180223/analytics5a8fa78d0fd23.jpg Explanations to the figures: For simplified wave analysis, the simplest type of wave is used in the form of a zigzag, combining 3 parts (A; B; C). Of these waves, all kinds of correction are composed and most of the impulses. At each time frame, the last, incomplete wave is analyzed. The areas marked on the graphs are indicated by the calculation areas, where the probability of a change in the direction of motion is significantly increased. Arrows indicate the wave counting according to the technique used by the author. The solid background of the arrows indicates the structure formed, the dotted one indicates the expected wave motion. Attention: The wave algorithm does not take into account the duration of the tool movements in time. The forecast is not a trading signal! To conduct a trade transaction, you need to confirm the signals of your trading systems. * The presented market analysis is informative and does not constitute a guide to the transaction. Read more: https://www.instaforex.com/forex_analysis/200339 |
[quote author=horlajumokhe post=65287514]Hello, I am interested in trading forex. Pls tell me how to start trading please, also how much is needed to start .[/quote First of all, we recommend you to familiarize yourself with the section “For Beginners” at our website - http://instaforex.com/for_beginners . Also a great many of helpful information was placed at our special educational website http://education.instaforex.com. After getting acquainted with the trading basics, the best decision will be to open a Demo-account (just download the trading terminal by this link: https://www.instaforex.com/trading_platform.php and after the program startup fill in the proper field in the emerged window). Having obtained necessary skills of trading on Demo-accounts you can start registration of a real trading account at our website: http://instaforex.com/open_live_account.php . You can start trading with minimum of $1. |
AUD/USD is approaching major support, prepare for a bounce Price is approaching major support at 0.7731 (Fibonacci extension, Fibonacci retracement, horizontal overlap support), and a strong bounce from this level would push the price up towards the 0.7986 resistance (Fibonacci retracement, horizontal swing high resistance). We have to be careful about intermediate resistance at 0.7890 too. Stochastic (34,5,3) is seeing major support at 0.4% where a corresponding bounce could occur. Buy above 0.7731. Stop loss at 0.7633. Take profit at 0.7986. https://forex-images.ifxdb.com/userfiles/20180222/analytics5a8e20b0a2672.png Read more: https://www.instaforex.com/forex_analysis/110294 |


