Instaforexbuk's Posts
Nairaland Forum › Instaforexbuk's Profile › Instaforexbuk's Posts
1 2 3 4 5 6 7 8 9 10 11 12 13 14 15 16 17 (of 19 pages)
Results of 5 InstaForex contests summed up We have determined winners of five InstaForex contests. Today we will reveal victors of the following competitions: One Million Option, InstaForex Sniper, Lucky Trader, FX-1 Rally, and Real Scalping. InstaForex congratulates the winners and wishes other contestants to notch up a victory next time. FX-1 Rally Andrey Bolovintsev demonstrated all his trading and racing skills and showed the best performance in the recent FX-1 Rally stage. We congratulate Andrey on the victory and wish him luck in upcoming competitions. If you long to feel the thrilling spirit of this fight, welcome to the start of another step of the FX-1 Rally contest. You can register for the nearest rally that will take place from 00:00 April 7, 2017 to 23:59 April 7, 2017. One Million Option The popular One Million Option InstaForex contest attracts lots of traders in every stage. The participants struggle to clinch the title of the best options trader. In the latest step, Mariya Bibikova showed the best result. The next stage of the One Million Option InstaForex contest will take place soon, from April 10, 2017 to April 14, 2017. Lucky Trader Confidence, prudence, and concentration on success are the key to victory and excellent results in the two-week marathon Lucky Trader. If you manage to trade perfectly for two weeks, you will become a winner just like Sergey Mednikov did it. The next stage will kick off on April 17, 2017 and end on April 28, 2017. InstaForex Sniper The fastest and most accurate traders compete in the InstaForex Sniper contest. According to the results of the recent step, Leander Sirotkin was the best. The next contest stage will start on April 10, 2017 and come to an end on April 17, 2017. Real Scalping Short-term trading is quite complicated and time-consuming and requires close attention. Not everyone is attentive, focused, and quick enough to succeed in the Real Scalping contest. This time Andrey Demin showed all these features and grabbed the first place. InstaForex congratulates the winner and invites other traders to take part in the contest. Everyone willing to challenge their skills can register for the Real Scalping contest on the InstaForex official website. The next competition will begin on May 1, 2017 and finish on May 26, 2017. |
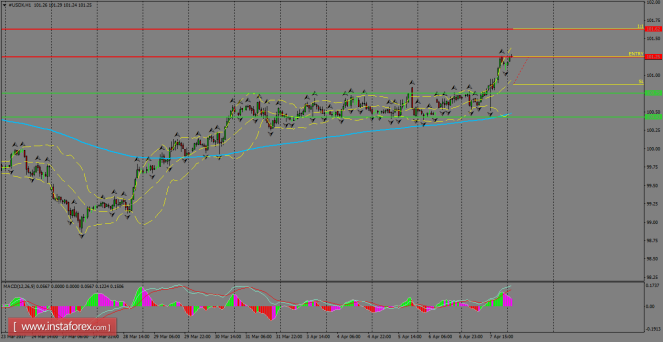
Daily analysis of USDX for April 10, 2017 The index had a strong bullish rally during Friday despite bad NFP data released in the United States. Currently, it's challenging the resistance zone of 101.25, which is the last hurdle before to reach the 101.62 level across the board. The overall view is still bullish, as it remains well consolidated above the 200 SMA in the Easter's week. https://forex-images.instaforex.com/userfiles/20170410/USDXH1.png H1 chart's resistance levels: 101.25 / 101.62 H1 chart's support levels: 100.75 / 100.43 Trading recommendations for today: Based on the H1 chart, place buy (long) orders only if the USD Index breaks with a bullish candlestick; the resistance level is at 101.25, take profit is at 101.62 and stop loss is at 100.87. Read more: https://www.instaforex.com/forex_analysis/90309 |
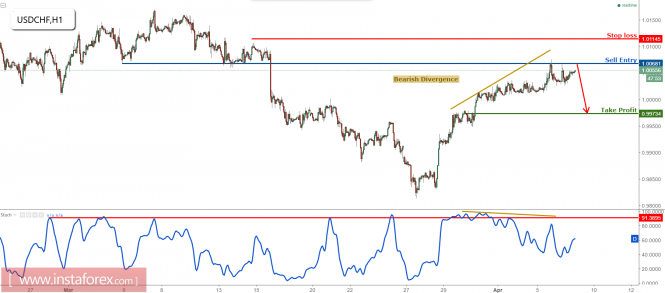
USD/CHF is at major resistance, remain bearish The price is now testing major resistance at 1.0068 (horizontal pullback resistance, Fibonacci retracement, and bearish divergence) and we expect a drop to at least 0.9973 support (Fibonacci retracement, bearish divergence potential). Stochastic (34,5,3) is seeing strong resistance below the 91% level and bearish divergence vs. the price is signaling that a major reversal is impending. Sell below 0.9991. Stop loss is at 1.0040. Take profit is at 0.9923. https://forex-images.instaforex.com/userfiles/20170407/analytics58e765feb1ce1.png Read more: https://www.instaforex.com/forex_analysis/90277 |
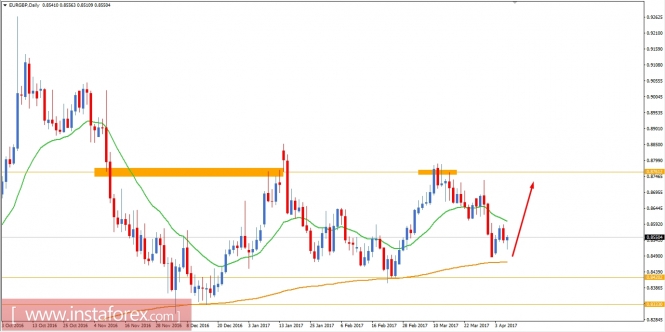
EUR/GBP fundamental analysis for April 6, 2017 EUR/GBP is currently residing inside a corrective structure between 0.8420 and 0.8760. Today EUR had a neutral day; ECB President Draghi spoke about upcoming monetary policy and the BREXIT effect which signaled positive statements on the favor of EUR. German Factory Orders report was also published today at 3.4% which was forecasted to be at 3.5% and Retail PMI was published at 49.5 which previously was at 49.9. On the EUR side only slight differences were observed in the economic reports but Draghi's speech made the market quite volatile after his speech. On the other hand, GBP had a negative Economic report of Housing Equity Withdrawal at -10.2B which was expected to be at -9.5B. After the negative GBP news was published, EUR had a greater push in the market against GBP and currently on the way to dominate the GBP for the rest of the day. Now let us look at the technical view, the price is currently showing a bearish rejection in the daily candle, whereas the dynamic support of 200 EMA seems to be backing up the price for an upside move. As of EUR is gaining strength over GBP and above 200 EMA, it is expected that the price will hit the resistance 0.8760. As the price remains above the 200 EMA we will be in bullish bias and only a daily close below the 200 EMA will negate our current bias. https://forex-images.instaforex.com/userfiles/20170406/analytics58e60acbeca6e.jpg Read more: https://www.instaforex.com/forex_analysis/90221 |
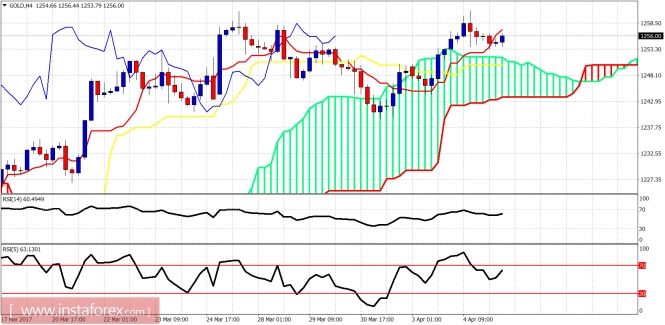
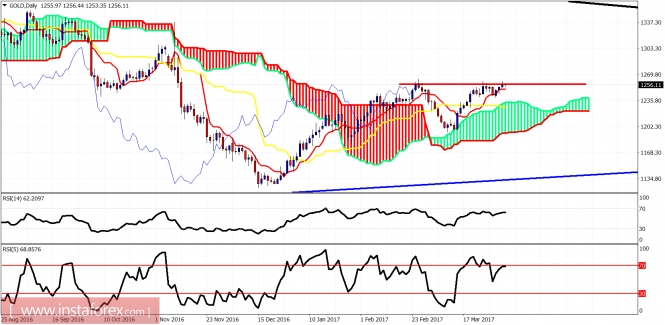
Ichimoku indicator analysis of gold for April 5, 2017 Gold price stopped its rise at the previous highs near $1,263 and is showing reversal signs. A back test of the break out area at $1,247-50 is justified. In the long term I remain bullish expecting a move to $1,300-$1,310 first. https://forex-images.instaforex.com/userfiles/20170405/analytics58e49ab67ab57.jpg Gold is trading above the Ichimoku cloud. Trend is bullish in the 4-hour chart. The price might re-test cloud support at $1,250. Short-term support is at $1,250 and the next is at $1,242. Resistance is at $1,263 and the next one is at $1,280-90. https://forex-images.instaforex.com/userfiles/20170405/analytics58e49aec6d3f0.jpg Red line - resistance The Daily candle is above the Ichimoku cloud. Trend is bullish. We have a daily cross of the tenkan-sen (red line indicator) above the kijun-sen (yellow line indicator) while above the cloud. This is a textbook bullish signal in Ichimoku terms. Read more: https://www.instaforex.com/forex_analysis/90151 |
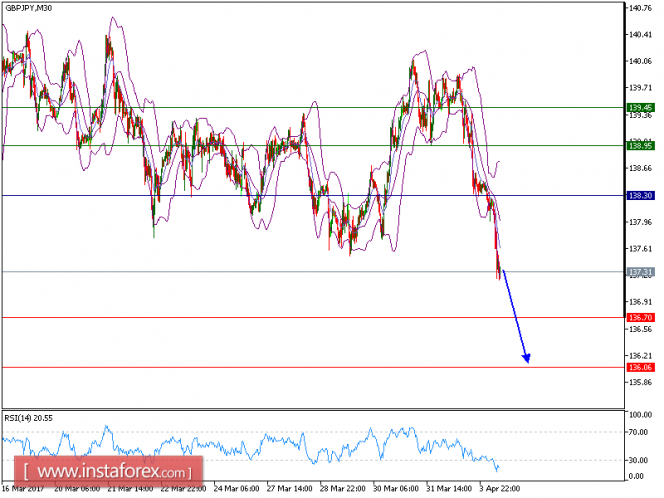
Technical analysis of GBP/JPY for April 04, 2017 https://forex-images.instaforex.com/userfiles/20170404/GBPJPYM30.png GBP/JPY is expected to prevail its downside movement. The pair remains in a down trend, capped by its falling 20-period and 50-period moving averages. The nearest key resistance at 118.60 maintains the strong selling pressure on the prices. Furthermore, the relative strength index is bearish below its neutrality level at 50. To sum up, as long as 138.30 is not surpassed, look for a return to 136.70 and 136.05 in extension. The pair is trading below its pivot point. It is likely to trade in a lower range as long as it remains below the pivot point. Short positions are recommended with the first target at 136.70. A break below this target will move the pair further downwards to 136.05. The pivot point stands at 138.30. If the price moves in the opposite direction and bounces back from the support level, it will move above its pivot point. It is likely to move further to the upside. According to that scenario, long positions are recommended with the first target at 138.95 and the second one at 139.45. Resistance levels: 138.95, 139.45, and 140.15 Support levels: 136.70,136.05, and 138.00 Read more: https://www.instaforex.com/forex_analysis/90095 |
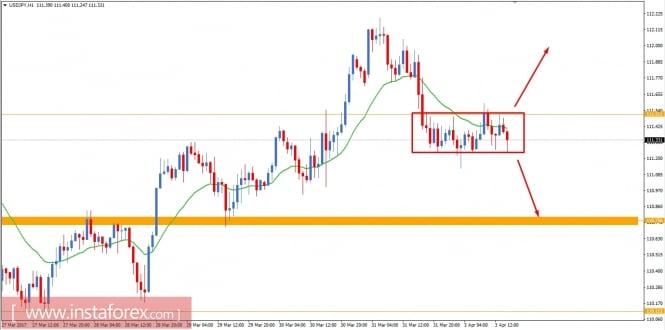
USD/JPY fundamental analysis for April 3, 2017 USD/JPY has been trading in range today after having an impulsive bearish move after bouncing off from 112.20 resistance area. Today JPY had Tankan Manufacturing Index report showed a decreased value at 12 which was expected to be at 14 but Tankan Non-Manufacturing Index report showed positive value at 20 which was expected to be at 19. So, overall a mixed view off the JPY news today. On the other hand, Today USD ISM Manufacturing PMI report is going to be published which is expected to be at 57.2 which previously was at 57.7 and Construction Spending is expected show some positive outcome at 1.0% which was at -1.0%. as the USD news gets published the market is expected to be volatile and today's daily close will disclose the upcoming move in this pair. Now let us look at the technical view, the price is currently contained inside the box of range between 111.20-50 area. A daily close above or below this area will clarify the upcoming move in this pair. As of the structural behavior, the price is expected to proceed towards a lower ground at 110.20. On the other hand, if the price breaks above 111.50 resistance then we will be looking forward to buy with a target towards 112.25-50 and so on. https://forex-images.instaforex.com/userfiles/20170403/analytics58e25607e2344.jpg Read more: https://www.instaforex.com/forex_analysis/90069 |
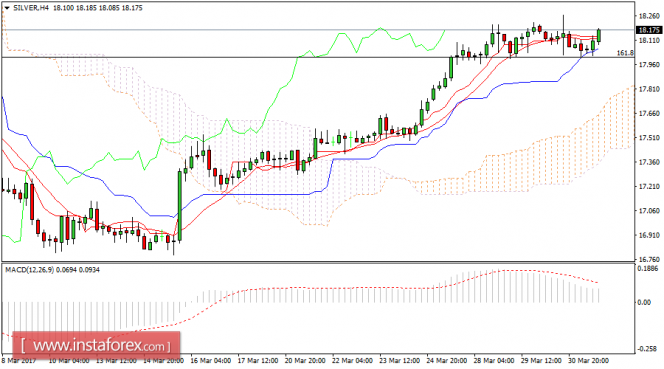
Daily analysis of Silver for March 31, 2017 https://forex-images.instaforex.com/userfiles/20170331/SILVERH4.png Overview Silver managed to reach our first main target at 18.30, showing some bearish bias. Now it is fluctuating around 18.00 barrier. Notice that stochastic gets rid of its negativity to enter the oversold areas now, which supports the chances of resuming the bullish trend in the upcoming sessions. The price needs to breach 18.30 to confirm extending the bullish wave towards 19.00. Therefore, we will continue to suggest the overall bullish trend supported by the EMA50, noting that the continuation of the bullish bias depends on holding above 17.43 and 17.10 levels. The expected trading range for today is between 17.90 support and 18.40 resistance. Read more: https://www.instaforex.com/forex_analysis/90009 |
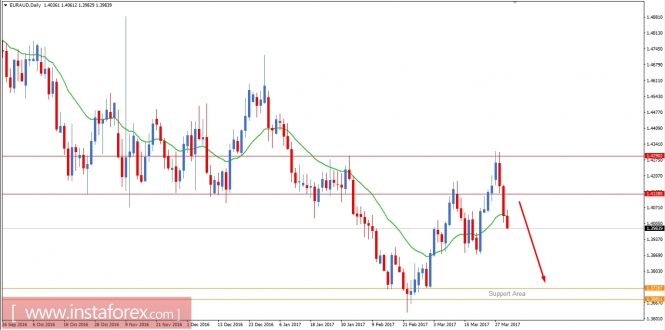
EUR/AUD fundamental analysis for March 30, 2017 EUR/AUD has reacted quite impulsively to the negative EUR economic events this week. The BREXIT effect seems to be affected quite negatively EUR against other currency crosses and negative economic reports are also pushing the situation much deeper. Today EUR had some negative reports of Spanish Flash CPI at 2.3% which was expected to be at 2.6% and German Prelim CPI at 0.2% which was expected to be at 0.4%. On the other hand, AUD started the day with a positive outcome of HIA New Home Sales at 0.2% which previously was negative at -2.2%. Overall, EUR has been seeing bad days getting out of the BREXIT situation and negative economic reports whereas AUD has maintained the consistency in sustaining the stronger position in the market. Now let us look at the technical view, the price has bounced off from the resistance area of 1.4130-1.4290. Currently the price is moving impulsively downward and having no good support in the way, the price is expected to reach the lowest support area of 1.3680-1.3730 in the coming days. Some retraces may take place to reach the support but the impulsiveness of sellers in the market does signify good amount of non-volatile bearish situation of the pair. https://forex-images.instaforex.com/userfiles/20170330/analytics58dd04b5dd2b4.jpg Read more: https://www.instaforex.com/forex_analysis/89951 |
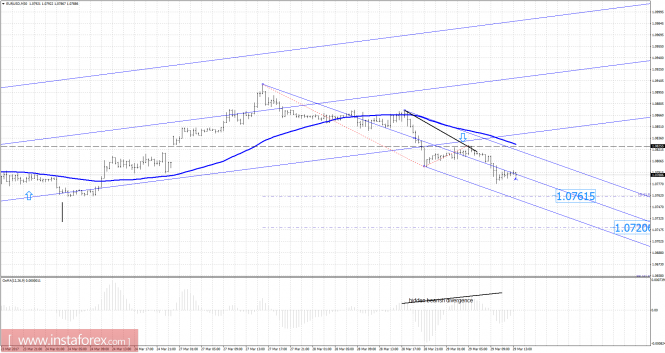
EUR/USD analysis for March 29, 2017 https://forex-images.instaforex.com/userfiles/20170329/analytics58db9486012cd.png Recently, the EUR/USD pair has been trading downwards. The price tested the level 1.0777. According to the 30M time frame, I found broken upward channel and hidden bearish divergence in the background which is a sign that buyers lost power and that sellers took control. There is also a downward channel and the price respecting the medium line. My advice is to watch for potential selling opportunities. I have placed Fibonacci expansion to find potential downward targets. I got Fibonacci expansion 61.8% at the price of 1.0760, Fibonacci expansion 100% at the price of 1.0720 and Fibonacci expansion 161.8% at the price of 1.0655. Resistance levels: R1: 1.0850 R2: 1.0875 R3: 1.0900 Support levels: S1: 1.0800 S2: 1.0780 S3: 1.0750 Trading recommendations for today: watch for potential selling opportunities. Read more: https://www.instaforex.com/forex_analysis/89867 |
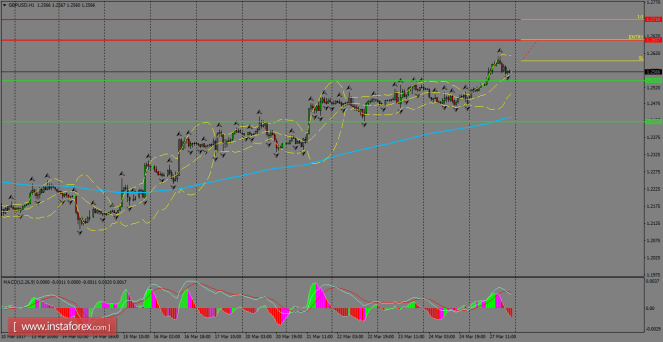
Daily analysis of GBP/USD for March 28, 2017 GBP/USD broke above the resistance level of 1.2539 and now it's headed to reach the 1.2657 zone. If the pair manages to consolidate above that area, we could expect another bullish wave to reach the 1.2718 zone in the short-term. However, the risk to the downside remains alive and the 200 SMA still provides a nice dynamic support. https://forex-images.instaforex.com/userfiles/20170327/GBPUSDH1.png H1 chart's resistance levels: 1.2657 / 1.2718 H1 chart's support levels: 1.2539 / 1.2420 Trading recommendations for today: Based on the H1 chart, buy (long) orders only if the GBP/USD pair breaks a bullish candlestick; the resistance level is at 1.2657, take profit is at 1.2718 and stop loss is at 1.2597. Read more: https://www.instaforex.com/forex_analysis/89779 |
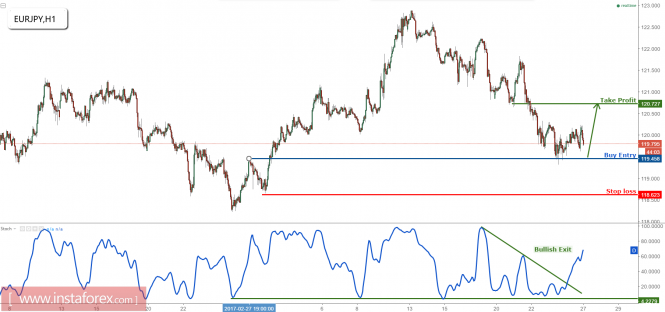
EUR/JPY is bouncing up nicely, remain bullish for a further rise The price has bounced up towards our profit target previously. Now we remain bullish above 119.45 support (Fibonacci retracement, horizontal pullback support, and recent swing low support) for a push up to 120.72 resistance (Fibonacci retracement, pullback resistance). Stochastic (55,5,3) is seeing strong support above 4% and has also made a bullish exit signaling that we will see further bullish momentum. Buy above 119.45. Stop loss is at 118.62. Take profit is at 120.72. https://forex-images.instaforex.com/userfiles/20170327/analytics58d8e1dc3a34d.png Read more: https://www.instaforex.com/forex_analysis/89749 |
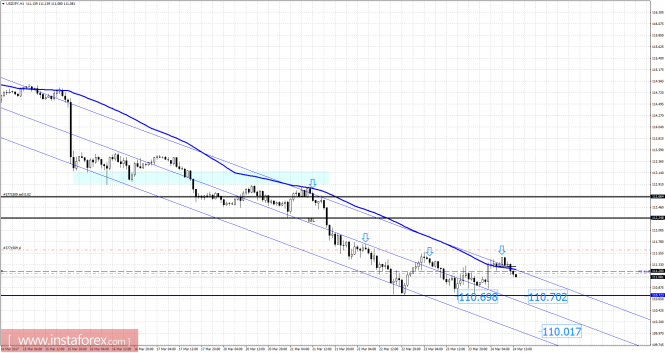
USD/JPY analysis for March 24, 2017 https://forex-images.instaforex.com/userfiles/20170324/analytics58d4efa094feb.png Recently, the USD/JPY pair has been trading sideways at the price of 111.10. According to the 1H time frame, I found powerlessness from the buyers to move USD/JPY higher, which is a sign of weakness. The USD/JPY is in short – term bearish trend. My advice is to watch for selling opportunities. Targets are set at the price of 110.70 and 110.00. Resistance levels: R1: 111.40 R2: 111.65 R3: 112.00 Support levels: S1: 110.70 S2: 110.50 S3: 110.10 Trading recommendations for today: watch for potential selling opportunities. Read more: https://www.instaforex.com/forex_analysis/89696 |
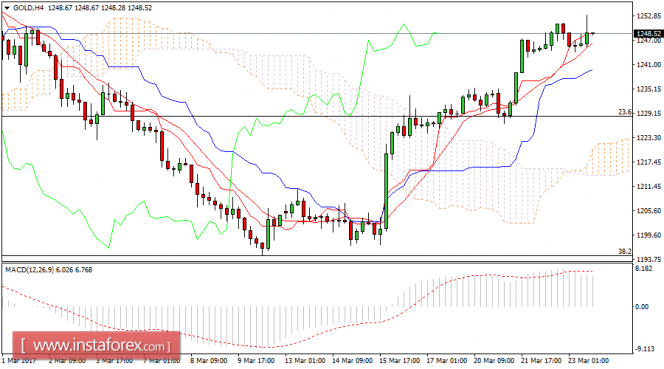
Daily analysis of Gold for March 23, 2017 https://forex-images.instaforex.com/userfiles/20170323/GOLDH4.png Overview Gold price fluctuates at the intraday bullish trend line that appears in the image. The stochastic reaches the thresholds of the oversold levels now, waiting for the price rally to resume the main bullish trend. Its next target is located at 1,263.17, reminding you that breaching 1,250.00 will reinforce the expectations for the continuation of the expected rise. In general, the bullish bias will remain preferred in the upcoming period unless breaking 1,231.13 level and holding below it. The expected trading range for today is between 1,235.00 support and 1,263.00 resistance. Read more: https://www.instaforex.com/forex_analysis/89643 |
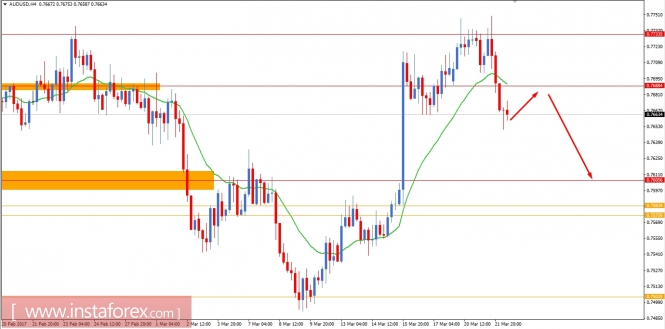
Fundamental analysis of AUD/USD for March 22, 2017 AUD/USD has been in a long leap upwards before bouncing off from the 0.7733 resistance level. Currently, the price id likely to make new lows along the path. Today AUD did not have any major economic event to get a push from other than MI leading Index (0.0% previous vs -0.1% released) and a speech of Assistant Governor Debelle on the key interest rates, which did not quite impress the market participants to buy AUD against USD. Today we have a few pieces of high-impact news on USD that are the Crude Oil Inventories report, which is expected to show an advance of 1.9M (-0.2M previously), and the existing home sales report (5.59 expected vs. 5.69 previous). Ahead of the US statistics, we will experience volatility in the market that might affect AUD in a greater extent. Now let us look at the technical view. The price has bounced and rejected the buyers off the resistance level 0.7733. After the bounce, there was an impulsive bearish move breaking below the nearest support 0.7690. Currently, we are expecting some retracement towards the new resistance 0.7690 to retest it before we see another downward move towards the 0.76 support level. On the other hand, if the price remains impulsive intradaily and takes out the previous H4 low at 0.7650 with a close below it, we will be looking forward to sell without any retracement towards the resistance. https://forex-images.instaforex.com/userfiles/20170322/analytics58d238fa7731c.jpg Read more: https://www.instaforex.com/forex_analysis/89561 |
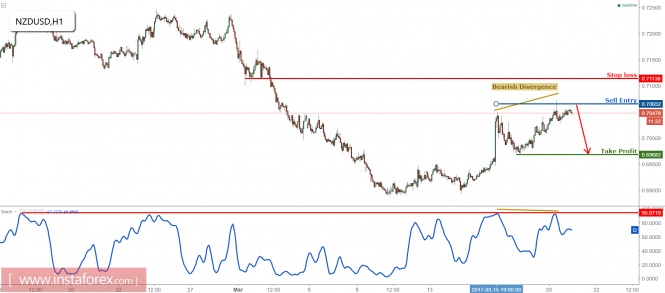
NZD/USD dropping perfectly from our selling area The price has reached our selling area as expected and is seeing a nice bearish reaction below 0.7065 resistance (Fibonacci retracement, Fibonacci extension) where we expect a drop to at least 0.6968 support (Fibonacci retracement, recent swing low support). Stochastic (21,5,3) sees major resistance at 95% and has bearish divergence vs price which signals a strong drop is impending. Sell below 0.7065. Stop loss at 0.7113. Take profit at 0.6968. https://forex-images.instaforex.com/userfiles/20170321/analytics58d10627ae2b2.png Read more: https://www.instaforex.com/forex_analysis/89533 |
EUR/USD Fundamental Analysis March 20, 2017 After the FOMC Meeting held on Wednesday, EUR/USD has surged up higher than recent highs made by the pair. As of sudden rate hike decision from 0.50-0.75 to 0.75-1.00, USD has got an opposite reaction from the market and price was just about to hit the resistance of 1.08 on Thursday. Friday was a bearish day for the pair but currently, as of sudden spike in the market, it is time for some correction to be made. Today market is expected to be corrective as Euro Group Meeting is going to be held for the whole day and on the USD side FOMC Member Evan is about to speak about the economic conditions and monetary policies of the country. Fundamentally today there is fewer things to be going on to provide any impulsive pressure or some volatility in this pair. Now let us look at the technical view, after breaking above the former resistance of 1.0630-40, the price is currently residing a few pips below the resistance of 1.08. As of Friday's bearish pressure from the middle of the range, it is expected that the price will move down toward the former resistance 1.0630-40 as support and if we see any bearish rejection off the level we will be buying with an upward target towards 1.08. The bullish bias is expected to continue until the price breaks below the support area of 1.0525-50. A daily close below the 1.0525-50 support area will negate the bullish bias. https://forex-images.instaforex.com/userfiles/20170320/analytics58cfbc49a79c7.jpg Read more: https://www.instaforex.com/forex_analysis/89467 |
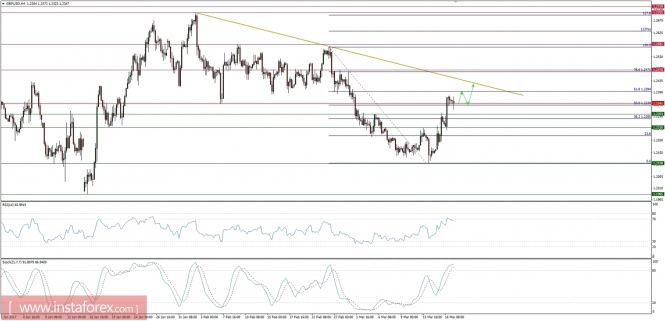
Global macro overview for 17/03/2017 The Bank of England hold the interest rate at 0.25% as anticipated. There was an 8-1 vote in favor of the decision with one of the Monetary Policy Committee members, Kristin Forbes, voted for a rate hike of 0.25%. The consensus expectations called for a 9-0 vote. In a case of a bond-buying program, there was no change as well and the voting was unanimous just as anticipated. In the official statement, the BoE said there were limits to the extent that above-target inflation can be tolerated. The recent inflation reading was better than anticipated and the rate may accelerate above the 2.0% target in the coming months. In conclusion, the BoE remains neutral, but still there is a chance of an interest rate hike in the nearest future and withdrawal of monetary stimulus over the next 3 years. Let's now take a look at the GBP/USD technical picture on the H4 time frame. Bulls have managed to break above the technical resistance at the level of 1.2345, but so far no continuation of the move has been seen. The next target for bulls would be the 61% Fibo at the level of 1.2394 and then the golden trend line resistance. The next support is seen at the level of 1.2303. https://forex-images.instaforex.com/userfiles/20170317/analytics58cb9d4c7ff50.jpg Read more: https://www.instaforex.com/forex_analysis/89389 |
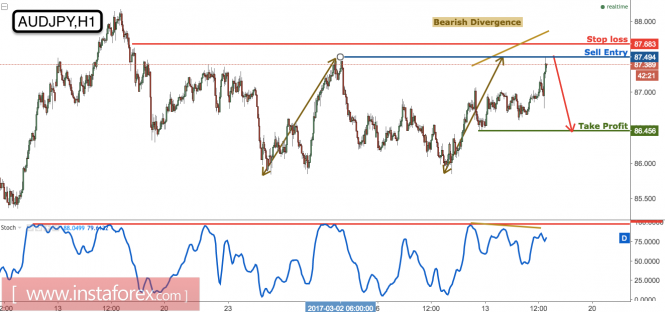
AUD/JPY on major resistance, prepare to sell Price is now testing major resistance at 87.49 (Fibonacci extension, horizontal resistance, bearish divergence) where we expect a drop to at least 86.45 support (Fibonacci retracement, horizontal swing low support). Stochastic (34,5,3) is seeing major resistance and also bearish divergence signaling an impending bearish reversal is approaching. Sell below 87.49. Stop loss at 87.68. Take profit at 86.45. https://forex-images.instaforex.com/userfiles/20170316/analytics58ca80e06890a.png Read more: https://www.instaforex.com/forex_analysis/89355 |
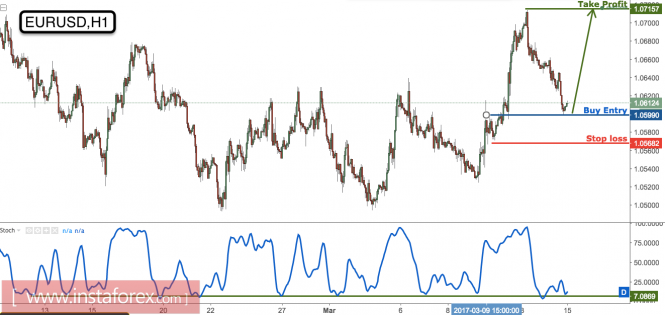
EUR/USD remains bullish above strong support We remain bullish above 1.0600 support (Fibonacci retracement, horizontal overlap support) for a bounce up to at least 1.0715 resistance (Fibonacci extension, Fibonacci retracement, recent swing high resistance). Stochastic (21,5,3) is seeing support at 5% where we expect a bounce from. We can also see a little bit of bullish divergence vs price signalling a bullish reversal is impending. Buy above 1.0600. Stop loss at 1.0568. Take profit at 1.0715. https://forex-images.instaforex.com/userfiles/20170315/analytics58c93cba30ba3.png Read more: https://www.instaforex.com/forex_analysis/89304 |
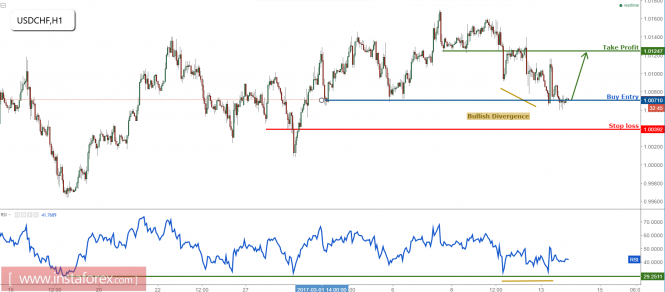
USD/CHF right on support, remain bullish Price has dropped perfectly to our buying level. We remain bullish above 1.0071 support (Fibonacci retracement, horizontal support) for a push up to 1.0124 resistance (Fibonacci retracement, horizontal overlap resistance). RSI (34) sees strong support above the 29% level and also sees bullish divergence vs price which signals a bounce is impending. Buy above 1.0071. Stop loss at 1.0039. Take profit at 1.0124. https://forex-images.instaforex.com/userfiles/20170314/analytics58c7ec6eae307.png Read more: https://www.instaforex.com/forex_analysis/89244 |
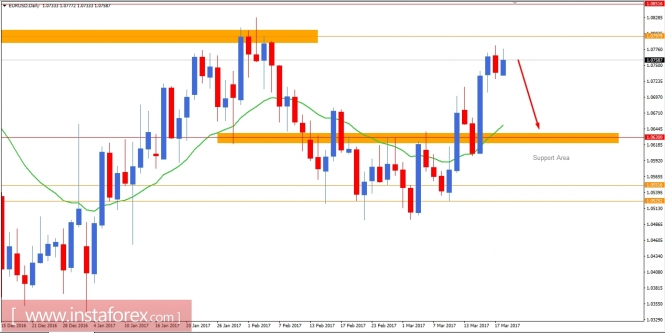
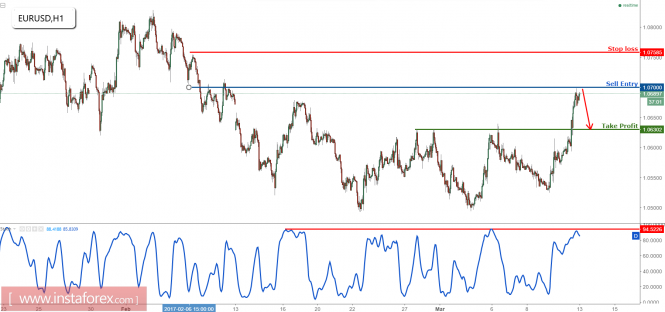
EUR/USD testing major resistance, remain bearish Price is testing major resistance at 1.0700 (Fibonacci retracement, horizontal overlap resistance) where we expect a drop from to at least 1.0630 (Fibonacci retracement, horizontal pullback support). Stochastic (34,5,3) is also seeing major resistance below the 94% level. Sell below 1.0700. Stop loss at 1.0758. Take profit at 1.0630. https://forex-images.instaforex.com/userfiles/20170313/analytics58c670670459c.png Read more: https://www.instaforex.com/forex_analysis/89168 |
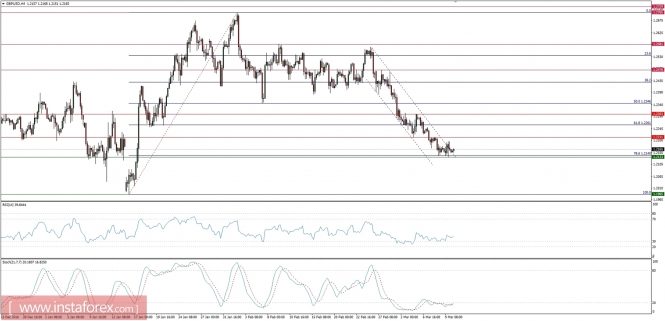
Global macro overview for 10/03/2017 Last Wednesday, the UK Finance Minister Philip Hammond presented his annual budget statement for the years 2017 - 2018. According to his projections, the previous UK economy expansion estimate of 1.4% expansion has been upgraded to 2.0%. Nevertheless, during the next year economic growth is expected to fall to 1.6% and then climb to 1.7% and 1.9% in 2019 and 2020, respectively. The return to 2.0% growth rate is expected in 2021. Moreover, the inflation expectation has been increased to the level of 2.4% in 2017, but then inflation is expected to decrease slightly to 2.3% in 2018. The Bank of England inflation target of 2.0% will be hit in 2019. In conclusion, a rather optimistic point of view from Hammond, that neglects all of the negative effects of a post-Brexit economy. The question remains, whether he took into account the possibility of success of the second Scottish referendum? Time will tell. Let's now take a look at GBP/USD technical picture at the H4 time frame. The price is currently trading just above the 78%Fibo at the level of 1.2140 in heavily oversold market conditions. Moreover, it looks like the bull camp is trying to establish a base for a bounce towards the intraday resistance at the level of 1.2211 as the price had broken out of the dashed channel already. If the level of 1.2133 is not clearly violated, the immediate bias has changed to slightly bullish. https://forex-images.instaforex.com/userfiles/20170310/analytics58c25e7478da3.jpg Read more: https://www.instaforex.com/forex_analysis/89098 |
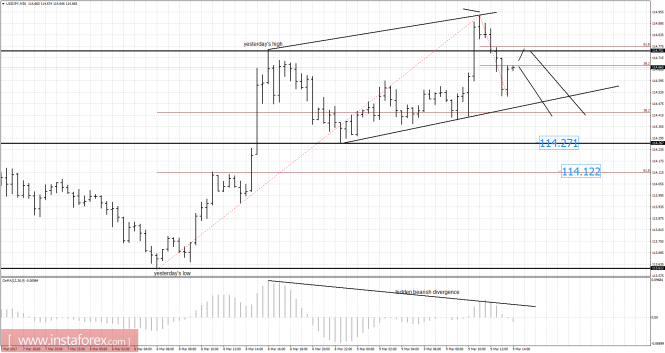
USD/JPY analysis for March 09, 2017 https://forex-images.instaforex.com/userfiles/20170309/analytics58c14b17d4a85.png Recently, the USD/JPY pair has been trading upwards. As I expected the price tested the level 114.93. According to the 30M time frame, I found that USD/JPY is overbought and that price faked breakout of yesterday's high, which is a sign that buying looks risky. My advice is to watch for potential selling opportuntities. I also found hidden bearish divergence on the moving average oscillator, which is another sign of weakness. Downward targets are set at the price of 114.27 and at the price of 114.12. Resistance levels: R1: 114.90 R2: 115.40 R3: 116.00 Support levels: S1: 113.70 S2: 113.00 S3: 112.50 Trading recommendations for today: watch for potential selling opportunities. Read more: https://www.instaforex.com/forex_analysis/89054 |
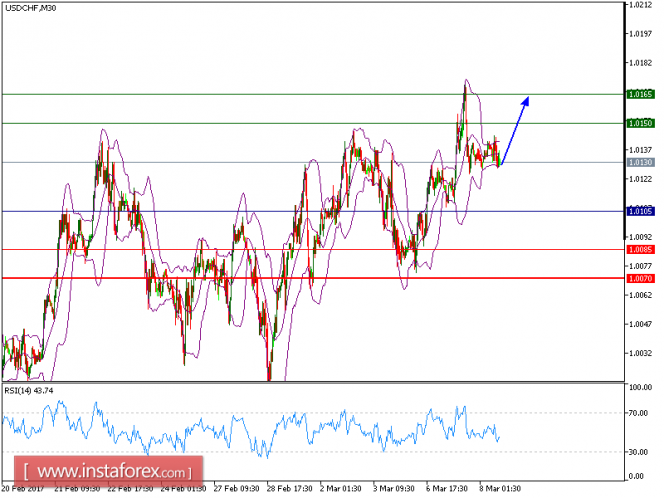
Technical analysis of USD/CHF for March 08, 2017 https://forex-images.instaforex.com/userfiles/20170308/USDCHFM30.png USD/CHF is expected to trade in higher range as the bias remains bullish. Although the pair retreated from 1.0170 (Mar 7 top), it is still trading above its rising 50-period moving average, which plays a support role. The relative strength index lacks downward momentum. In addition, the downside potential should be limited by the key support level at 1.0105 (Mar 7 low). As long as this key level is not broken, look for a further upside to 1.0150 and 1.0170 in extension. To conclude, as long as 1.0135 is not surpassed, look for a further drop to 1.0060 and 1.0040 in extension. Resistance levels: 1.0150, 1.0165, and 1.0185 Support levels: 1.0085, 1.0070, and 1.0040 Read more: https://www.instaforex.com/forex_analysis/89005 |
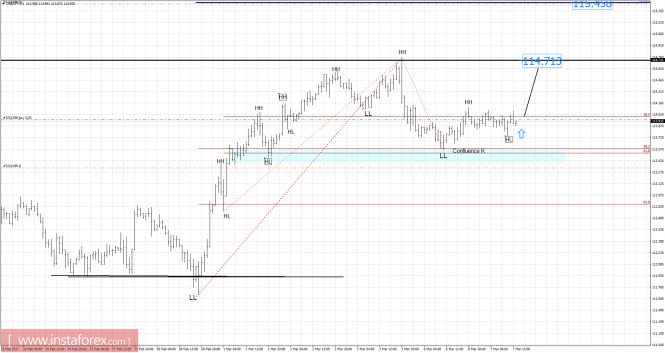
USD/JPY analysis for March 07, 2017 https://forex-images.instaforex.com/userfiles/20170307/analytics58bea24ab60fe.png Recently, the USD/JPY pair has been trading sideways at the price of 113.95. According to the 1H time frame, I found Fibonacci confluence at the price of 113.60-113.50. The price rejected from the confluence area which is a good sign for potential bullish movement. My advice is to watch for potential buying opportunities. The targets are set at the price of 114.70 (swing high) and the price of 115.45 (Fibonacci expansion 61.8%). Resistance levels: R1: 114.17 R2: 114.45 R3: 114.80 Support levels: S1: 113.55 S2: 113.25 S3: 112.95 Trading recommendations for today: watch for potential buying opportunities. Read more: https://www.instaforex.com/forex_analysis/88943 |
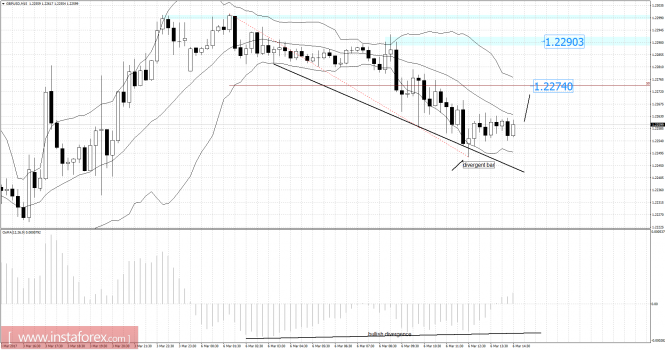
GBP/USD analysis for March 06, 2017 https://forex-images.instaforex.com/userfiles/20170306/analytics58bd58f5bf048.png Recently, GBP/USD has been trading sideways at the price of 1.2260. According to the 15M time frame, I found a hidden bullish divergence on the moving average oscillator, which is a sign that selling looks risky. There is also a divergent bar, which is another sign of potential strength. My advice is to watch for potential intraday buying opportunities. I placed Fibonacci retracement to find potential target. Fibonacci retracement 50% is set at the price of 1.2275 (first target). The second target is set at the price of 1.2290 (swing high). Resistance levels: R1: 1.2300 R2: 1.2305 R3: 1.2310 Support levels: S1: 1.2290 S2: 1.2285 S3: 1.2280 Trading recommendations for today: watch for potential buying opportunities due to bullish divergence in the background. Read more: https://www.instaforex.com/forex_analysis/88907 |
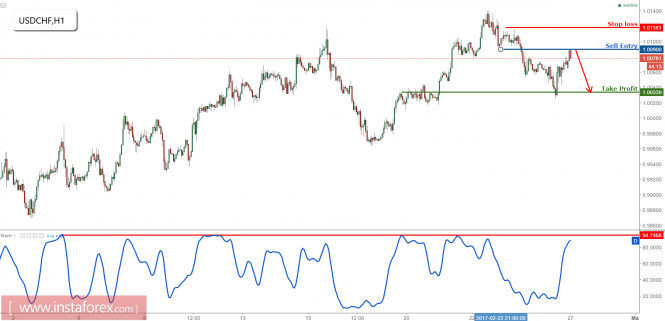
USD/CHF reached our profit target perfectly, time to start selling The price has reached our buying area, bounced perfectly and reached our profit target from Friday. Now we turn bearish below 1.0090 resistance (Fibonacci retracement, horizontal pullback resistance) where we expect a reaction from a drop to 1.0033 support (Fibonacci retracement, horizontal support). Stochastic (21) is seeing strong resistance at the 94% level. Sell below 1.0090. Stop loss is at 1.0118. Take profit is at 1.0033. https://forex-images.instaforex.com/userfiles/20170227/analytics58b441ddb283d.png Read more: https://www.instaforex.com/forex_analysis/88635 |
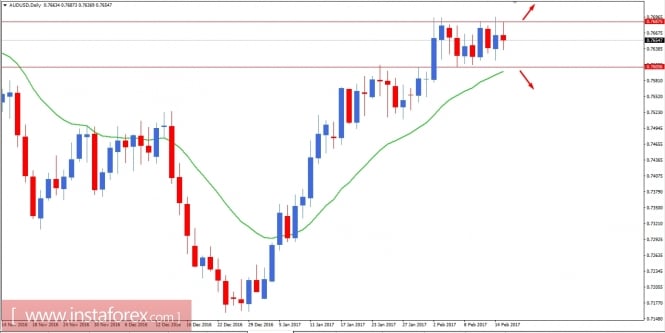
AUD/USD fundamental analysis for February 15, 2017 The AUD/USD pair has been stuck between 0.7605 and 0.7687 area since last two weeks. After a massive bullish pressure from December, AUD has progressed well against USD. Today data on Westpac Consumer Sentiment were released with a positive figure of 2.3% which was previously 0.1% and New motor vehicle sales also increased by 0.6% which was previously 0.1%. This week there was no remarkable news, which might have impact on AUD, to push AUD higher to break the 0.7687 resistance. On the other hand, CPI report was published with 0.6% which was expected 0.3% and Core CPI was 0.3% which was forecasted 0.2%. Retail sales also had a significant increase of 0.4% which was expected 0.1%. Overall, USD is fundamentally quite strong due to high impact reports with positive results of the economy. So, there are some positive chances for USD to gain strength against AUD. Now let us look at the technical view, the price is ranging between 0.7605 and 0.7687. Today market retested the 0.7687 resistance and the price bounced back inside the range without showing any sign of breaking above it. With economic events for the whole week and positive reports, there are higher chances that the price will break the support 0.7605-00 and proceed lower to 0.7500-50 area. On the other hand, if the price breaks above the resistance with a daily close we will be looking forward to buy with a target towards 0.80. https://forex-images.instaforex.com/userfiles/20170215/analytics58a468a0c1b26.jpg Read more: https://www.instaforex.com/forex_analysis/88117 |
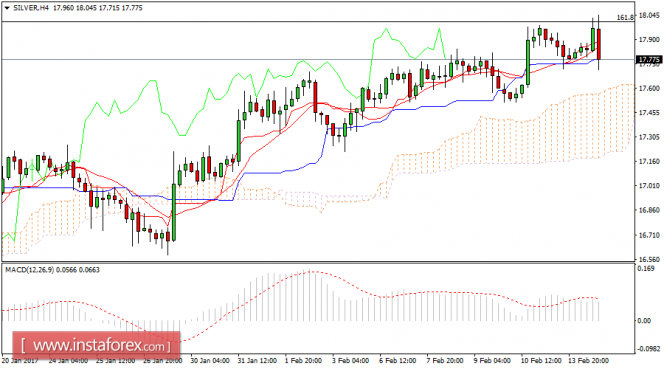
Daily analysis of Silver for February 14, 2017 https://forex-images.instaforex.com/userfiles/20170214/SILVERH4.png Overview Silver traded slightly negatively yesterday. Notice that stochastic managed to get rid of its negativity and gaining the positive momentum on the 4-hour time frame, forming positive motive that we wait to push the price to resume its bullish track in the upcoming sessions. Its targets begin at 18.30 and extend to 19.38 after breaching the previous level. In general, the bullish trend will remain active unless breaking 17.43 level and holding below it. While, breaking of this level will push the price to test 16.56 level before any new positive attempt. The expected trading range for today is between 17.60 support and 18.30 resistance. Read more: https://www.instaforex.com/forex_analysis/88059 |
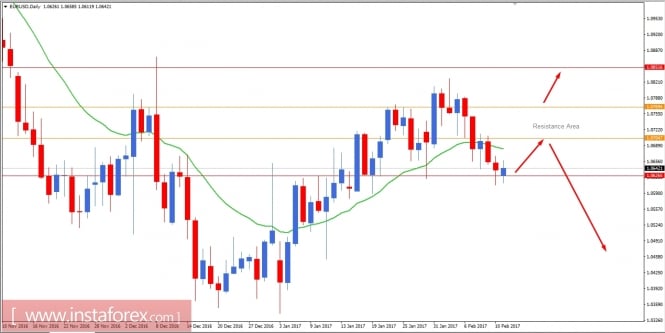
EUR/USD Fundamental Analysis February 13, 2017 After a massive selling off last week EUR/USD has reached the base support at 1.0627. Today, the market opened with 8 pips gap and within few hours the gap was filled as the EUR started gaining strength after hitting the support. Currently, EUR has been seen getting strength over USD and market is above the support level. Today, there is no economic event for USD where EU Economic forecast is currently undergoing and as of the market reaction EUR is seen to gain strength over the USD. Due to some pending decisions of President Mr. Donald Trump on tax related issues the market is currently in an indecisive state where USD is expected to gain power after a certain retracement on the EUR side earlier this week. Now let us look at the technical view of the market, price has reached the near-term support level which was already respected many times in future and being respected currently. If the price remains above the support level 1.0627, it is expected that bulls will gain strength over USD for a day or two till the price pulls back to the resistance area between 1.0715-50. From the resistance area, if we see any bullish rejection from the resistance area we will be looking forward to sell as the bias is still bearish. On the other hand, if the market breaks above 1.0750 with a daily close, we will be looking forward to buy with a target toward 1.0850 as the first target and 1.1060 as the second target upwards. https://forex-images.instaforex.com/userfiles/20170213/analytics58a19b7989f64.jpg Read more: https://www.instaforex.com/forex_analysis/87996 |


