Instaforexbuk's Posts
Nairaland Forum › Instaforexbuk's Profile › Instaforexbuk's Posts
1 2 3 4 5 6 7 8 9 10 11 12 13 (of 19 pages)
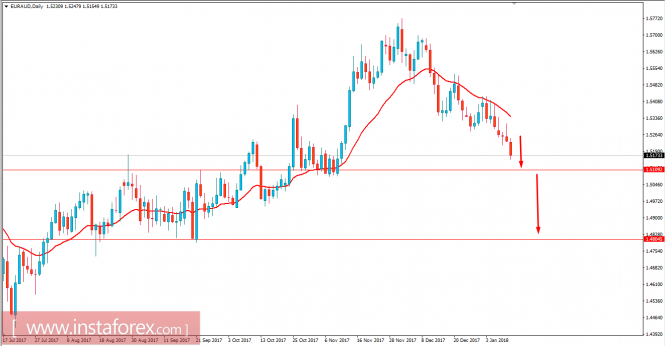
Fundamental Analysis of EUR/AUD for January 11, 2018 EUR/AUD has been impulsively bearish recently after bouncing off the 1.5400 price area and dynamic level of 20 EMA. AUD has been quite positive with the economic reports which helped the currency to gain momentum over EUR which is struggling to make an impact on the bullish growth. Today AUD Retail Sales report was published with a significant increase to 1.2% from the previous value of 0.5% which was expected to decrease to 0.4%. The increase in Retail Sales helped the currency to gain impulsive momentum over EUR which is expected to continue further in the coming days. On the other hand, today EUR Italian Retail Sales report is going to be published which is expected to increase to 0.8% from the previous negative value of -1.0%, Industrial Production report is expected to increase to 0.8% from the previous value of 0.2% and ECB Monetary Meeting Accounts report is going to be published today as well which is expected to be quite neutral in nature. Despite having a good forecast for the upcoming economic reports of EUR today, AUD has been quite impulsive with the gains already which would be pretty tough for EUR to recover from. As of the current scenario, AUD is expected to gain more momentum in the coming days taking the price much lower. Now let us look at the technical view. The price has been bearish since it bounced off the dynamic level rejecting it for several times before it finally started to be impulsive with the gains. There has been a lot of corrections along the way but due to today's positive economic reports, AUD gained the momentum which is required to dominate EUR for the coming days. As the price remains below 1.5400 and dynamic level of 20 EMA with a daily close the bearish bias is expected to continue further. https://forex-images.ifxdb.com/userfiles/20180111/analytics5a56fcf32ffeb.png |
plato091:As a beginner please go to the following link: https://www.ifxid.com/getting_started. In the Training Video section you will find educational materials dedicated to understanding the uniqueness of how to work with InstaForex, trading theories, technical indicators, FAQs on Forex trading composed of questions that clients often ask, Opening Demo accounts, Forex Glossary pages consists of existing trading terms and their explanations. You can familiarize yourself with the information on the educational page http://education.ifxid.com/ |
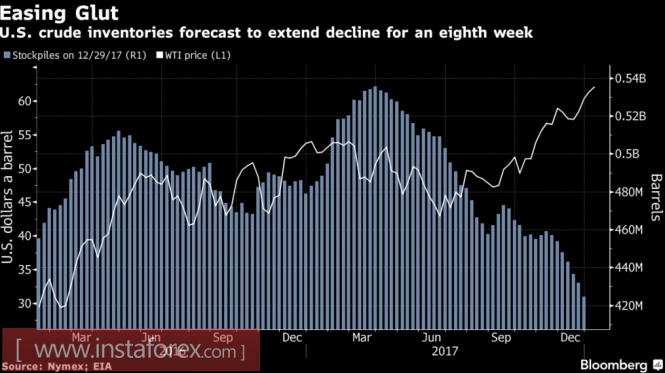
Brent: "Bears" threw a towel into the ring Frosts in the northeastern United States, the continuing decline in US oil reserves, the anti-government strikes in Iran, the high level of compliance with contractual obligations by OPEC members, and the weakness of the dollar pushed the quotations of Brent and WTI to the area of three-year highs. However, some of black gold's advantages, in particular, problems with supplies in the North Sea and in Libya, have already been played. Tehran has not reduced production and the US currency is beginning to win back part of the losses incurred at the turn of 2017-2018 decline. These circumstances require that the "bulls" have evidence that they are able to retain both varieties at current levels. According to the consensus forecast of Bloomberg experts, by the week ending in January 5, oil reserves in the United States have already decreased by 1.5 million barrels. If this is the case, the figure will drop 8 five consecutive days and will reach a minimum mark since the beginning of 2015. At the same time, the number of drilling rigs, according to the latest report of Baker Hughes, unexpectedly decreased by 5. It seems that the rate that shale oil producers will increase its own activity as WTI moved above $ 60 per barrel, was not justified. However, this threat made Iran's oil minister say that OPEC does not want Brent to go far from $ 60. Dynamics of WTI and US oil reserves https://forex-images.ifxdb.com/userfiles/20180109/analytics5a54ab90847fd.png Source: Bloomberg. Tehran is forced to use this rhetoric as part of the "bullish" news for black gold comes from it. The country, which accounts for about 4% of world production (3.8 million bpd), cannot afford to live in the face of the growing risks of an anti-government coup. It indeed has retained its previous production levels but who knows what will happen tomorrow. The situation is aggravated by the conflict between Iran and Saudi Arabia over Yemen as well as rumors that Donald Trump will not confirm the terms of the nuclear deal with Tehran. The renewal of sanctions is fraught with a reduction in world production and rising prices. The world demand plays an important role in the current Brent and WTI rally. According to IMF forecasts, the global GDP will grow by 3.6% in 2018. At the same time the increase in consumption of black gold increased to 5 million bpd from 2015 to 2017. However, at the time when the North Sea grade was quoted at $ 100 per barrel or higher, it did not reach +1 million bpd. The continuation of the northern oil campaign will have an impact not only on demand, but also on inflation. Accelerated growth in consumer prices in the US will contribute to the aggressive monetary restriction of the Fed, which will strengthen the position of the dollar. Currently, the US currency has an undisclosed potential. First, the market ignored the factor of tax reform and it is quite capable of winning it back. Second, the divergence in the monetary policy of the Fed and its main competitors continues to work in favor of the USD index. Technically, if the "bulls" for Brent manage to keep the positions won, then the risks of continuing the rally in the direction of the target by 200% on the AB = CD pattern will increase. On the contrary, falling prices below $ 66.95 per barrel will open the door for correction. Brent, daily chart https://forex-images.ifxdb.com/userfiles/20180109/analytics5a54ab9b8ee24.png |
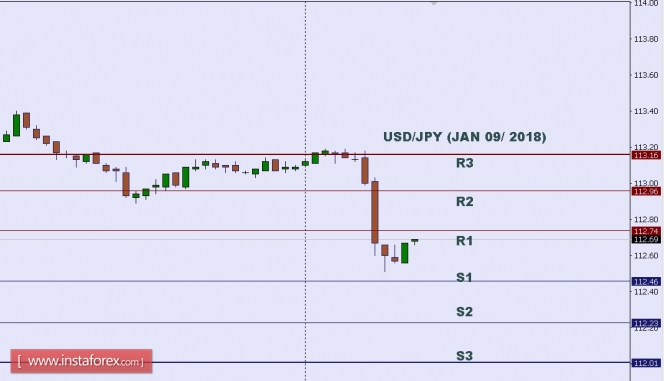
Technical analysis of USD/JPY for Jan 09, 2018 https://forex-images.ifxdb.com/userfiles/20180109/USDJPY.jpg In Asia, Japan will release the Consumer Confidence and Average Cash Earnings y/y data, and the US will release some Economic Data such as IBD/TIPP Economic Optimism, JOLTS Job Openings, and NFIB Small Business Index. So, there is a probability the USD/JPY will move with a low to medium volatility during this day. TODAY'S TECHNICAL LEVEL: Resistance. 3: 113.16. Resistance. 2: 112.96. Resistance. 1: 112.74. Support. 1: 113.46. Support. 2: 112.23. Support. 3: 112.01. Disclaimer: Trading Forex (foreign exchange) on margin carries a high level of risk, and may not be suitable for all investors. The high degree of leverage can work against you as well as for you. Before deciding to invest in foreign exchange you should carefully consider your investment objectives, level of experience, and risk appetite. The possibility exists that you could sustain a loss of some or all of your initial investment and therefore you should not invest money that you cannot afford to lose. You should be aware of all the risks associated with foreign exchange trading, and seek advice from an independent financial advisor if you have any doubts. *The market analysis posted here is meant to increase your awareness, but not to give instructions to make a trade. Read more: https://www.instaforex.com/forex_analysis/106964 |
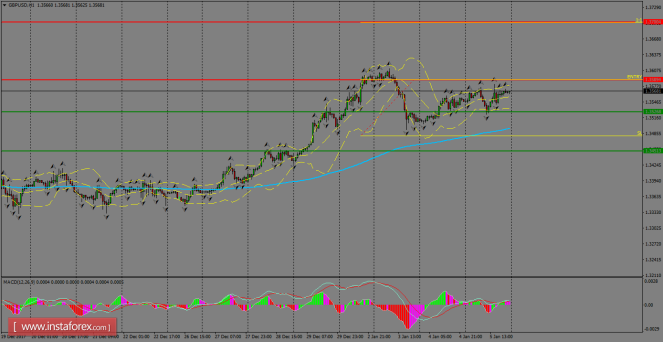
Daily analysis of GBP/USD for January 08, 2018 GBP/USD hadn't a major reaction to the US NFP outcome on Friday, as it remains trading in a tight range across the board. Currently, the pair is being supported by the 1.3526 level, which should give enough momentum in order to strengthen the bullish bias and it will help to push it to test the resistance zone of 1.3700. MACD indicator remains in favor of the bulls. https://forex-images.ifxdb.com/userfiles/20180107/GBPUSDH1.png H1 chart's resistance levels: 1.3589 / 1.3700 H1 chart's support levels: 1.3526 / 1.3451 Trading recommendations for today: Based on the H1 chart, buy (long) orders only if the GBP/USD pair breaks a bullish candlestick; the resistance level is at 1.3589, take profit is at 1.3700 and stop loss is at 1.3480. Read more: https://www.instaforex.com/forex_analysis/106858 |
[color=teal]Technical analysis of USD/JPY for Jan 05, 2018 [/color] https://forex-images.ifxdb.com/userfiles/20180105/USDJPY.jpg Japan will release the Monetary Base y/y and the US will reveal some Economic Data such as Factory Orders m/m, ISM Non-Manufacturing PMI, Trade Balance, Unemployment Rate, Non-Farm Employment Change, and Average Hourly Earnings m/m . So there is a probability the USD/JPY pairwill move with medium to high volatility during this day. TODAY'S TECHNICAL LEVEL: Resistance. 3: 113.34. Resistance. 2: 113.12. Resistance. 1: 112.90. Support. 1: 112.62. Support. 2: 112.40. Support. 3: 112.18. Disclaimer: Trading Forex (foreign exchange) on margin carries a high level of risk, and may not be suitable for all investors. The high degree of leverage can work against you as well as for you. Before deciding to invest in foreign exchange you should carefully consider your investment objectives, level of experience, and risk appetite. The possibility exists that you could sustain a loss of some or all of your initial investment and therefore you should not invest money that you cannot afford to lose. You should be aware of all the risks associated with foreign exchange trading, and seek advice from an independent financial advisor if you have any doubts. *The market analysis posted here is meant to increase your awareness, but not to give instructions to make a trade. Read more: https://www.instaforex.com/forex_analysis/106788 |
Wave analysis of the GBP / USD currency pair for January 4, 2018 [Img] https://forex-images.ifxdb.com/userfiles/20180104/analytics5a4dda1ee1037.gif[/img] Analysis of wave counting: On the whole, it is expected that the breakdown of the level of the 36th figure led to a fairly dynamic decline in the price of the pair GBP / USD at the beginning of yesterday's European session by almost 120 percentage points from the previously reached maximum (1.3610). Thus, the emerging wave situation allows us to assume (with some stretch) that the currency pair has completed the formation of the third wave and has already designated the beginning of the 4th wave, in the 5th, a, B, C, C, (C). In this case, in the case of a downward movement to 1.3300, the 2nd wave, in the 5th, a, B, C, C, (C), significantly complicates its internal wave structure. The objectives of building the downward wave: 1.3480 - 11.4% by Fibonacci 1.3291 - 23.6% by Fibonacci 1.3200 The objectives for the construction of an upward wave: 1.3600 - 1.3700 General conclusions and trade recommendations: The construction of the upward trend section continues. It is now possible to resume the increase in quotes within the wave 5, 5, a, B, C, C, (C) with targets that are about 36 and 37 figures. The overbought indicators allow the probability of complicating the wave 2, 5, a, B, C, C, (C). *The market analysis posted here is meant to increase your awareness, but not to give instructions to make a trade. Read more: https://www.instaforex.com/forex_analysis/197061 |
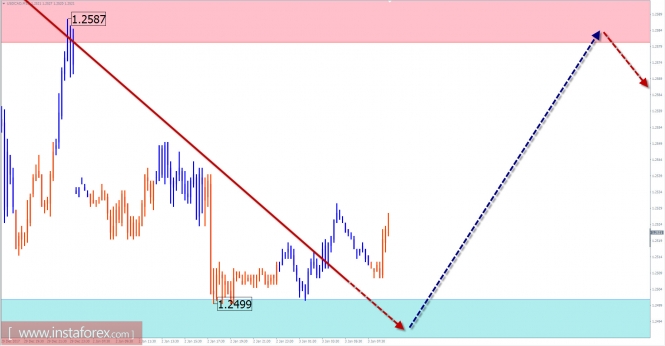
[color=black]Trade review for January 3 by simplified wave analysis [/color] Overview and forecast for EUR / USD The graph of the European currency in the main pair against the dollar after the correction period resumed its growth. The quotes of the pair reached a critical point again, which divides the two main options for the future scenario. In the first case, the current stretched plane of large scale will be continued further. An alternative option involves pre-shaping the correction at a higher wave level. Today is probably the end of the rise of the past days. Turning is not expected above the resistance zone levels. At the beginning of the course of the price down can be calculated in the second half of the day. The lower limit of the daily course of the pair is the settlement support. The boundaries of the resistance zones: - 1.2080 / 1.2110 The boundaries of the support zone: - 1.2000 / 1.1970 [Img]https://forex-images.ifxdb.com/userfiles/20180103/analytics5a4c87c51255b.jpg [/img] Overview and forecast for USD / CAD The direction of the short-term trend on the chart of the major pair of the Canadian dollar is set by the upward wave of September 8 last year. During the last 2 months, the price is adjusted, forming a wave zigzag. The preliminary calculation of the target zone gives, as the nearest landmark of the completion of the wave, the mid-hundred, and twenty-fifth price pattern. Today, the formation of a corrective rollback is likely. The flute nature of price fluctuations will become dominant. The swing upwards limits the calculated resistance zone. Then you should wait for a return to the main course of the movement and a new section for strengthening the Canadian currency. The boundaries of the resistance zones: - 1.2580 / 1.2610 The boundaries of the support zones: - 1.2500 / 1.2470 https://forex-images.ifxdb.com/userfiles/20180103/analytics5a4c87d098dec.jpg Explanations to the figures: For simplified wave analysis, the simplest type of wave is used in the form of a zigzag, combining 3 parts (A; B; C). Of these waves, all kinds of correction are composed and most of the impulses. At each time frame, the last, incomplete wave is analyzed. The areas marked on the graphs are indicated by the calculation areas, where the probability of a change in the direction of motion is significantly increased. Arrows indicate the wave counting according to the technique used by the author. The solid background of the arrows indicates the structure formed, the dotted one indicates the expected wave motion. Attention: The wave algorithm does not take into account the duration of the tool movements in time. The forecast is not a trading signal! To conduct a trade transaction, you need to confirm the signals of your trading systems. *The market analysis posted here is meant to increase your awareness, but not to give instructions to make a trade. Read more: https://www.instaforex.com/forex_analysis/196967 |
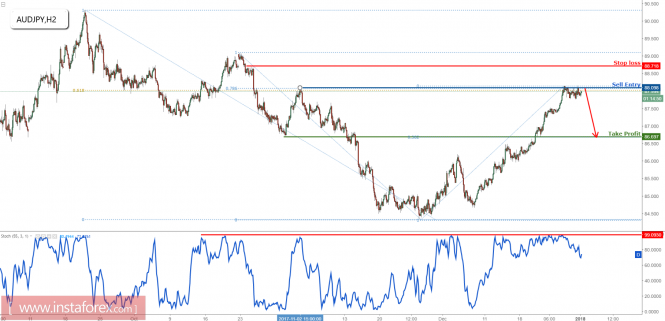
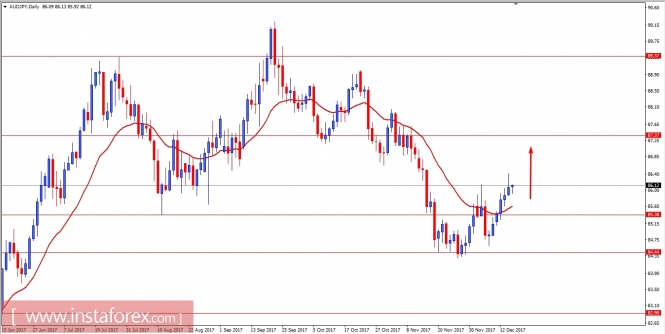
AUD/JPY testing major resistance, time to go short Price is testing major resistance at 88.09 (Fibonacci retracement, horizontal swing high resistance) and we expect a strong drop from this level towards 86.69 support (Fibonacci retracement, horizontal support). Stochastic (55,3,1) is seeing major resistance at 99% and is starting to drop nicely signalling a further drop could be expected. Sell below 88.09. Stop loss at 88.71. Take profit at 86.69. https://forex-images.ifxdb.com/userfiles/20180102/analytics5a4ae22d0d6ac.png |
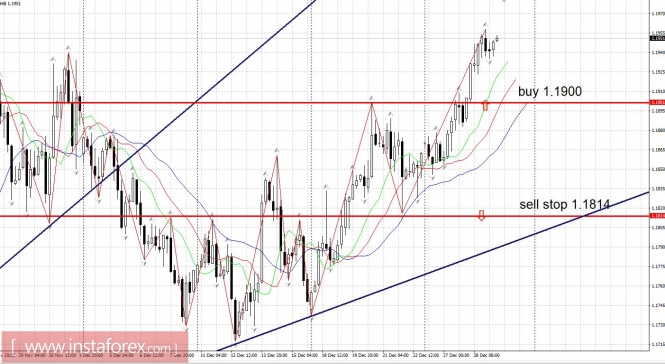
Burning Forecast 29/12/2017 Burning Forecast 29/12/2017 EURUSD: Buy from kickbacks. The euro was on the growth trend in the final days of 2017. A break above 1.1900 and the consolidation above this level is a strong signal for growth. At the moment, the course is testing the next important resistance of 1.1960 - and, if successful, a target of 1.2080 - a peak of the year. Purchases are possible, but we must bear in mind that on the first trading day of January, and generally during the first week, there is a high probability of strong gaps and sudden unpredictable movements. Therefore, we are buying the euro from 1.1900. Merry Christmas and Happy New Year! [Img]https://forex-images.ifxdb.com/userfiles/20171229/analytics5a45e68403637.jpg [/img] |
saidubaba:you have to open an InstaForex trading account so as to be able to trade forex. |
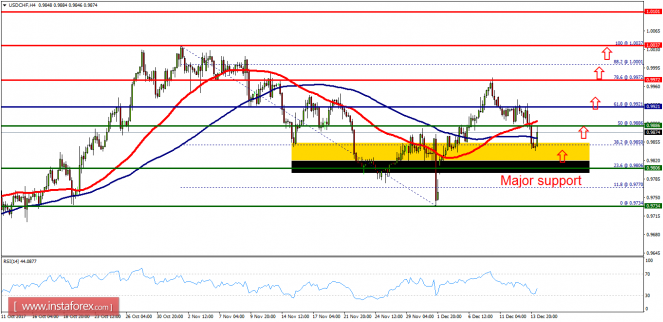
Technical analysis of USD/CHF for December 28, 2017 https://forex-images.ifxdb.com/userfiles/20171228/USDCHFM30.png USD/CHF is expected to trade with a bearish outlook. The pair is clearly reversing down, capped by its falling 20-period and 50-period moving averages. The recent bearish breakout of a key horizontal level at 0.9885 should open the downside path toward 0.9810. Last but not least, the relative strength index is badly directed and calls for a new pullback. To conclude, as long as 0.9875 isn't surpassed, look for further downsides to 0.9810 and 0.9795 in extension. Chart Explanation: The black line shows the pivot point. The present price above the pivot point indicates a bullish position, and the price below the pivot points indicates a short position. The red lines show the support levels and the green line indicates the resistance levels. These levels can be used to enter and exit trades. Strategy: SELL, Stop Loss: 0.9875, Take Profit: 0.9810 Resistance levels: 0.9900, 0.9915, and 0.9935 Support levels: 0.9810, 0.9795, and 0.9750 *The market analysis posted here is meant to increase your awareness, but not to give instructions to make a trade. Read more: https://www.instaforex.com/forex_analysis/106356 |
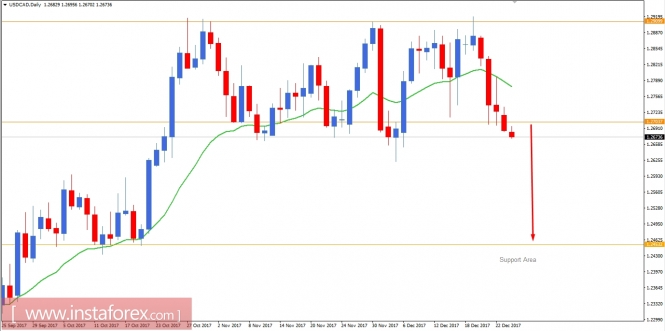
Fundamental Analysis of USD/CAD for December 27, 2017 USD/CAD is currently quite bearish, having 1.27 support level cleared with a daily close which opened the doors for the price to proceed much downward in the coming days. CAD has been quite positive with the gains recently despite a lack of any economic reports or events to support its recent gains, but it seems like the weakness of USD is the working factor in this case. USD has been quite weaker recently amid mixed economic reports which made the US currency lose ground against other rival currencies. Today, US CB Consumer Confidence report is going to be published which is expected to decrease to 128.2 from the previous figure of 129.5 and Pending Home Sales is expected to be negative at -0.4% from the previous value of 3.5%. The economic reports from the US are quite negatively forecasted. If that happens, then CAD is going to dominate further in the coming days until the US comes up with any positive economic reports or events to help it regain the momentum it has lost recently. Now let us look at the technical chart. The price is currently hovering below the 1.2700 event level which held the price earlier. However, this time the price had a break with a daily close below the level which indicates that the price is going to proceed much lower towards 1.2450 in the coming days. As the price remains below 1.27 with a daily close, the bearish bias is expected to continue further. https://forex-images.ifxdb.com/userfiles/20171227/analytics5a4342d7b6642.jpg Read more: https://www.instaforex.com/forex_analysis/106258 |
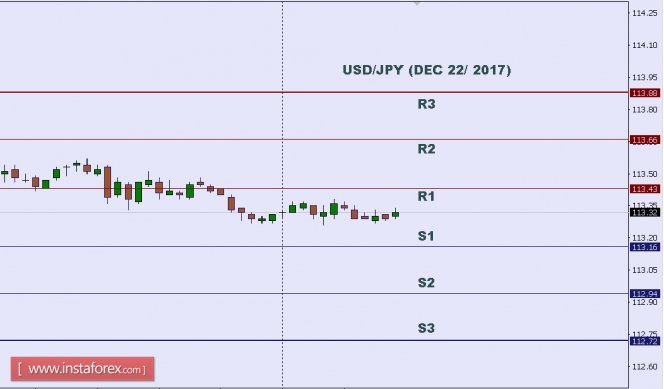
Technical analysis of USD/JPY for Dec 22, 2017 https://forex-images.ifxdb.com/userfiles/20171222/USDJPY.jpg In Asia, today Japan will not release any Economic Data, but the US will release some Economic Data such as Revised UoM Inflation Expectations, Revised UoM Consumer Sentiment, New Home Sales, Personal Income m/m, Personal Spending m/m, Durable Goods Orders m/m, Core PCE Price Index m/m, and Core Durable Goods Orders m/m. So, there is a probability the USD/JPY will move with a low to medium volatility during this day. TODAY'S TECHNICAL LEVEL: Resistance. 3: 113.88. Resistance. 2: 113.66. Resistance. 1: 113.43. Support. 1: 113.16. Support. 2: 112.94. Support. 3: 112.72. Disclaimer: Trading Forex (foreign exchange) on margin carries a high level of risk, and may not be suitable for all investors. The high degree of leverage can work against you as well as for you. Before deciding to invest in foreign exchange you should carefully consider your investment objectives, level of experience, and risk appetite. The possibility exists that you could sustain a loss of some or all of your initial investment and therefore you should not invest money that you cannot afford to lose. You should be aware of all the risks associated with foreign exchange trading, and seek advice from an independent financial advisor if you have any doubts. *The market analysis posted here is meant to increase your awareness, but not to give instructions to make a trade. Read more: https://www.instaforex.com/forex_analysis/106067 |
EUR/USD analysis for December 21, 2017 https://forex-images.ifxdb.com/userfiles/20171221/analytics5a3ba9da8318e.png Recently, the EUR/USD pair has been trading sideways at the price of 1.1860. Anyway, according to the 30M time – frame, I found a broken rising wedge forrmation inside of a lager broadening wegde formation, which is a sign that buying looks risky. My advice is to watch for potential selling opportunities. I have placed Fibonacci retracement to find potential downward targets. I got FR 38.2% at the price of 1.1840, FR 50% at the price of 1.1820 and FR 61.8% at the price of 1.1800. Resistance levels: R1: 1.1905 R2: 1.1940 R3: 1.1980 Support levels: S1: 1.1835 S2: 1.1795 S3: 1.1760 Trading recommendations for today: watch for potential selling opportunities. *The market analysis posted here is meant to increase your awareness, but not to give instructions to make a trade. Read more: https://www.instaforex.com/forex_analysis/106025 |
Changes in trading hours during the Christmas and New Year holidays Dear traders, We urge you to take notice of changes in the schedule of global trading sessions amid the Christmas and New Year holidays. December 22, trading will be conducted in a regular mode. December 25, markets will be closed. December 26, trading will resume only after 6:00 am of the server time. December 27-29, trading will be available for all instruments according to the standard schedule. January 1, markets will be closed. January 2, trading will resume only after 6:00 am of the server time. January 3, trading will be conducted according to the standard schedule. Besides, trading such currency pairs as USD/RUB and EUR/RUB will be halted from January 2 until January 8. These pairs will available for trading since January 9. Please be aware that from December 25, 2017 through January 3, 2018, the company retains the right to restrict opening new deals on some trading instruments such as Forex Crosses 4 and 5. However, traders can close current deals in a regular mode. Importantly, this is just preliminary information, so the schedule could be updated later. https://forex-images.ifxdb.com/company_news/userfiles/new_year_work_time_2.jpg |
Fundamental Analysis of USD/CAD for December 20, 2017 USD/CAD is currently trading below the resistance area of 1.29 after recent impulsive bullish pressure. The price has been trapped inside the corrective range of 1.27 to 1.29 for a few months. Meanwhile, bulls have been the most dominant side with consistent gains. Recently due to the Federal Funds Rate hike, USD gained good momentum over CAD, so that the price is expected to move much higher in the coming days. Nevertheless, any positive economic report from Canada this month may help to offset the impulsive bullish pressure. Today, Canada's Wholesale Sales report is expected to show an increase to 0.5% from the previous value of 1.2% which is expected to have a minimal impact on the CAD progress in the coming days. On the USD side, today Existing Home Sales report is going to be published which is expected to increase to 5.53M from the previous figure of 5.48M and Crude Oil Inventories is expected to show less deficit to -3.6M from the previous figure of -5.1M. Additionally, on Thursday (tomorrow) US Final GDP report is going to be published which is expected to be unchanged at 3.3%. Besides, Canada's CPI is expected to increase to 0.2% from the previous value of 0.1% and Core Retail Sales is expected to increase to 0.4% from the previous value of 0.3%. As for the current scenario, the pair is likely to trade with higher volatility by tomorrow. So, we can have some decent understanding about the upcoming directional movement in the pair. Though USD has already have the upper hand over CAD, any positive economic report from Canada tomorrow may lead to strong CAD resilience inside the corrective range area. Now let us look at the technical chart. The price has recently rejected off the resistance level of 1.29 which led to further bearish pressure which is currently visible today. The pair is trading above the dynamic level of 20 EMA inside the corrective range between 1.27 and 1.29. As the price remains below 1.29 with a daily close, the bearish bias is expected to continue to push the price towards 1.27 in the coming days. In any case, if the price breaks above 1.2900, the bullish pressure is expected to strengthen and push the price higher towards 1.30 and later towards 1.3250 resistance area in the future. https://forex-images.ifxdb.com/userfiles/20171220/analytics5a3a1a7921c4c.jpg Read more: https://www.instaforex.com/forex_analysis/105897 |
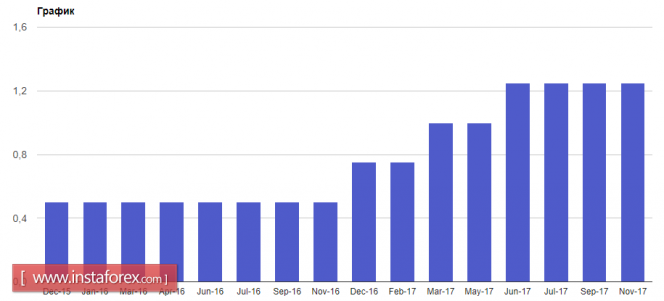
Global macro overview for 19/12/2017 During the Asian session, the global investors got acquainted with meeting minutes from the December Reserve Bank of Australia meeting, where, as expected, the main interest rate was maintained at 1.5%. In the minutes, investors can find hawkish accents regarding the prospects for the Australian labor market and generally favorable conditions in the economy, which should contribute to the increase in wage pressure and inflation. It is worth to notice, that recently the RBA has decided to remove the phrase saying that "inflation will most likely remain low for some time" from the recent meeting minutes. In addition, the bank is still convinced that the low level of interest rates is support for the economic climate and ensures sustainable economic growth and the return of inflation to the target in the medium term. Although there are no interest rate hikes on the horizon, the notes supported slightly the Australian Dollar. Let's now take a look at the AUD/NZD technical picture at the H4 time frame. The markets still corrects the last drops. The current upward correction from 0.7500 has exceeded the maximum correction in the total downward impulse from 0.8123, which in technical terms supports the demand side of this pair. The nearest resistance in the form of converging average EMA 100- and 200-periodic D1 scale is at the level of 0.7698. Exit above the round level of 0.77 should lead to a continuation of increases in the area of 0.7750. The 50-period average EMA on a daily basis determines support at 0.7645. https://forex-images.ifxdb.com/userfiles/20171219/analytics5a39137f94ce8.jpg Read more: https://www.instaforex.com/forex_analysis/105829 |
[color=#4080FF]Chancy Deposit: win $8,000 in December![/color] Dear traders, We are pleased to inform you that we increased the bonus amount in the Chancy Deposit Campaign up to $8,000 ahead of Christmas and the New Year. From now on, topping up an account with a sizable deposit, you automatically become a participant of the campaign, thus getting the chance to win $8,000. Besides, we remind you that the Chancy Deposit campaign is held on a monthly basis. So, any holder of a trading account, registered for the campaign, can be chosen as a winner. In other words, you just keep on your trading routine and one day you could be rewarded with a pleasant bonus. To your surprise, a bonus size varies every month. https://forex-images.ifxdb.com/company_news/userfiles/xmas17.jpg |
Litecoin and ripple trading suspended Please adjust your trading decisions to the news that litecoin and ripple trading is halted temporarily due to abnormal price swings which entailed technical faults in the order execution. To fix faults in the mechanism of generating quotes and executing orders, the maintenance works are underway. The company expects these assets to be available for trading in the nearest two weeks. Meanwhile, our clients can trade bitcoin in the routine mode. |
[color=black]Notification of changes in trading conditions[/color] Please be aware that a margin size for trading instruments belonging to cryptocurrencies has been changed since December 15, 2017 as the company is taking measures to streamline trading conditions. The information on new margin values is available on the web page with specifications of trading instruments. |
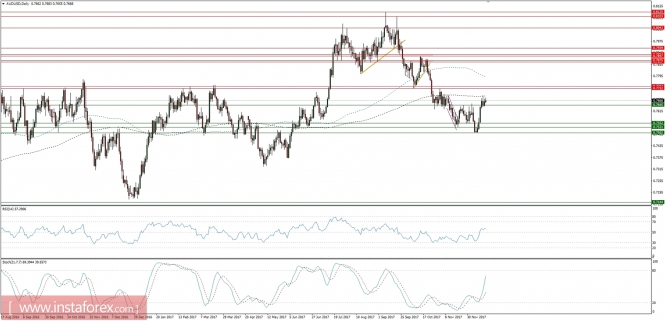
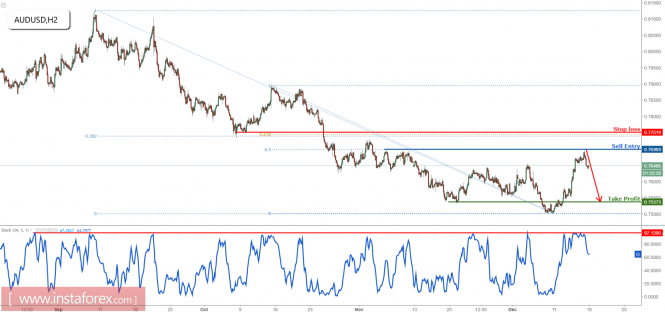
AUD/USD reversing perfectly, time to start selling The price touched our selling level and reversed perfectly. We remain bearish below our selling area major resistance at 0.7698 (Fibonacci retracement, horizontal swing high resistance) for a further drop down to at least 0.7537 support (Fibonacci retracement, horizontal overlap support). Stop loss is at 0.7751 (Multiple Fibonacci retracements, horizontal pullback resistance). Stochastic (34,3,1) is seeing major resistance below our 97% and is reversing nicely below this level. Sell below 0.7698. Stop loss is at 0.7751. Take profit is at 0.7537. https://forex-images.ifxdb.com/userfiles/20171218/analytics5a3729a43fc12.png Read more: https://www.instaforex.com/forex_analysis/105640 |
Fundamental Analysis of AUD/JPY for December 15, 2017 AUD has been dominating over JPY this week in light of upbeat high impact economic reports, supporting the gains. Recently, Australia's Employment Change report was published with a significant increase to 61.6k from the previous figure of 7.8k which was expected to increase to 18.1k and Unemployment Rate remained unchanged at 5.4% as expected. The positive economic report from Australia helped the currency to gain momentum, so the aussie has trimmed earlier losses against JPY. On the other hand, JPY has been showing a mixed dynamic amid economic reports released this week that resulted in weak bearish pressure in the pair. Today, Japan's Tenkan Manufacturing Index report was published with an increase to 25 from the previous figure of 22 which was expected to be at 24 and Tenkan Non-Manufacturing Index was published unchanged which was expected to increase to 24. The mixed economic reports quite confused the market sentiment, but AUD seems to have taken over quite well and is expected to climb even higher in the coming days. As for the current scenario, AUD is expected to gain further against JPY in the short term quite well unless any high impact positive economic report from Japan injects some volatility and bearish pressure in the market. Now let us look at the technical chart. The price is currently residing above the support area of 84.40 to 85.40 and dynamic level of 20 EMA after some correction and volatility inside the area. As the price remains above the support area, the bullish bias is expected to continue with target towards 87.40 resistance area. https://forex-images.ifxdb.com/userfiles/20171215/analytics5a335d477811b.jpg Read more: https://www.instaforex.com/forex_analysis/105577 |
Technical analysis of USD/CHF for December 14, 2017 https://forex-images.ifxdb.com/userfiles/20171214/USDCHFH4.png Overview: Pivot point : 0.9921. The USD/CHF pair didn't make any significant movements for that the price is still moving around the area of 0.9806 and 0.9921. Besides, it should be noted that the bias remains bullish in the nearest term testing 1.0037 or higher. The USD/CHF pair continues to move upwards from the level of 0.9806. Last week, the pair rose from the level of 0.9806 to the top around the area of 0.9921 (pivot). Today, the first resistance level is seen at 0.9972 followed by 1.0037, while daily support 1 is seen at 0.9886. According to the previous events, the USD/CHF pair is still moving between the levels of 0.9886 and 1.0037; for that, we expect a range of 150 pips. If the USD/CHF pair fails to break through the support level of 0.9886, the market will rise further to 0.9972. This would suggest a bullish market because the RSI indicator is still in a positive area and does not show any trend-reversal signs. The pair is expected to climb higher towards at least 1.0037 with a view to testing the double top. Briefly, the major support is seen at the price of 0.9806. So, it will be very useful to buy above the spot of 0.9806 with the targets of 0.9921 and 1.0037. On the other hand, if a breakout takes place at the support level of 0.9800, then this scenario may become invalidated. *The market analysis posted here is meant to increase your awareness, but not to give instructions to make a trade. Read more: https://www.instaforex.com/forex_analysis/105517 |
The US will raise interest rates today The US dollar tried to strengthen its position against the euro and the pound ahead of the important decision by the Fed regarding interest rates. As many experts expect, the Federal Reserve System will tighten the terms of monetary policy today, as the economy and inflationary pressure continue to show growth. Yesterday, the data increased again according to the budget deficit of the US government in November 2017 due to the fact that expenditures exceeded tax revenues. According to the US Treasury, the budget deficit rose to $139 billion in November this year, from $137 billion in November 2016. The Congressional Budget Office expected the deficit to came in at $134 billion. Government revenues in November grew by 4 percent. Further discussion related to tax reform was mentioned on this indicator. Despite the fact that the final version of the tax reform has not yet been submitted and approved, many expect successful negotiations on its current course. The main issue is related to the corporate tax rate, which is proposed to reduce by 22% or 21%, and in some cases up to 20% from the current 35%. Thus, the US government can not count the taxes for 1.4 trillion dollars. It is expected that this report will be submitted already this Friday and put to a vote in both chambers next week. As noted above, the focus for today will be on the Fed's decision. Most likely, the Central Bank will raise interest rates today for the third time this year and will provide hints about the further tightening of the monetary policy next year. https://forex-images.ifxdb.com/userfiles/20171213/%D0%91%D0%B5%D0%B7%D1%8B%D0%BC%D1%8F%D0%BD%D0%BD%D1%8B%D0%B9.png As for the technical picture of EUR/USD, the bulls managed to win back the decline of euro yesterday during the second half of the day and returned to the intermediate level of support at 1.1740. While the trade is going above this range, a further upward trend for the euro can be considered with an update of 1.1775 and an exit to the weekly highs around 1.1810. Traders of the British pound are in a state of confusion and waiting for new signals to solve the problem with Brexit. It can be recalled last week that the parties reached some progress in the negotiations, and currently expects that EU leaders will allow the UK to proceed to the next stage of the negotiations, which consists of the discussion about interim agreement on the transition period. Also, the UK needs to develop and agree on new principles for the future trade agreement. Remember, many countries recently expressed their disapproval, about being connected with the granting of the special status to the UK trading partner during the period of the Brexit procedure. * The presented market analysis is informative and does not constitute a guide to the transaction. Read more: https://www.instaforex.com/forex_analysis/195733 |
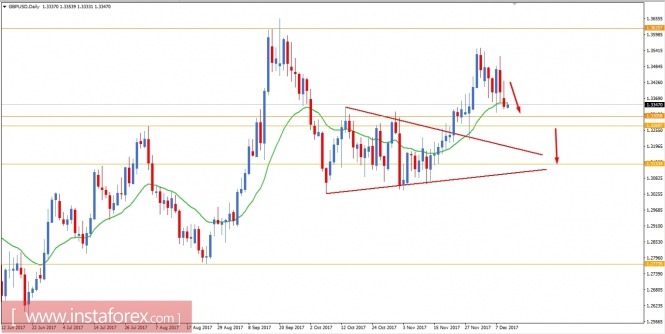
Fundamental Analysis of GBP/USD for December 12, 2017 GBP/USD is currently quite bearish in nature having strong rejection of the bulls yesterday by bouncing off the weekend gap created in the market. This week, both central banks in the UK and the US are holding policy meetings. The US Fed is widely expected to increase its funds rate to 1.50% from the previous value of 1.25%. Next day, the Bnak of England is going to announce its policy decision, so the key interest rate is expected to remain unchanged at 0.50%. By the end of this week, a good amount of volatility is expected along with a directional bias of the market. This should be analized to track the upcoming direction in this pair. Today, the UK CPI report is going to be published which is expected to be unchanged at 3.0%, PPI Input report is expected to increase to 1.6% from the previous value of 1.0%, RPI report is expected to show a slight increase to 4.1% from the previous value of 4.0%, Core CPI is expected to be unchanged at 2.7%, HPI report is expected to decrease to 5.2% from the previous value of 5.4%, and PPI Output is expected to be unchanged at 0.2%. On the USD side, today the US PPI report is going to be published which is expected to be unchanged at 0.4%, Core PPI report is expected to decrease to 0.2% from the previous value of 0.4%, and NFIB Small Business Index report is expected to increase to 104.6 from the previous figure of 103.8. As for the current scenario, the pair is already quite volatile but with the upcoming high impact economic events and reports, the pair is expected to get a directional bias which is most likely to be on the USD side, taking the price much lower in the coming days. Now let us look at the technical chart. The price is currently showing some bearish pressure off the dynamic level of 20 EMA above the support area of 1.33. The price is expected to break below 1.33 to reach the lower support area of 1.31 area in the coming days. The rate rike decision on Wednesday opens doors for the USD to gain more momentum. As the price remains below 1.35, the bearish bias is expected to continue further. https://forex-images.ifxdb.com/userfiles/20171212/analytics5a2f84352a669.jpg Read more: https://www.instaforex.com/forex_analysis/105284 |
Wave analysis of the USD/CHF currency pair for December 11, 2017 https://forex-images.ifxdb.com/userfiles/20171211/analytics5a2e35c6e6597.gif Analysis of wave counting: Friday's trading started with the upward movement, however, the USD/CHF pair, could not gain a foothold above 0.9975 and before the end of trading rolled back more than 50 percentage points from the high reached in the middle of the day. At the same time, it can be assumed that, while remaining in the stage of formation of the wave c, in a, in C, the currency pair completed its internal 3rd wave and already designated the 4th wave. If this is the case, then the attempt to test the level of the 99th figure can lead to the resumption of the growth of quotations in the direction of targets for this wave c, in a, in C, located above the level of price parity. At the same time, the probability of continuation of the beginning of the downward movement to the level of 0.9655 and the significant complication of the internal wave structure of wave b, in a, in C, continues to remain relevant. Targets for an upward wave option: 1.0004 - 127.2% by Fibonacci 1.0050 - 161.8% by Fibonacci Targets for a downlink wave option: 0.9728 - 50.0% by Fibonacci General conclusions and trading recommendations: The currency pair continues to build an upward set of waves. The assumed wave b, in a, in C has completed its construction near the mark of 0.9728, which corresponds to 50.0% of Fibonacci. If this is the case, an extended increase in quotations is now expected with targets near the estimated levels of 1.0004 and 1.0050, which corresponds to 127.2% and 161.8% of Fibonacci retracement (these targets will be reviewed). Read more: https://www.instaforex.com/forex_analysis/195559 |
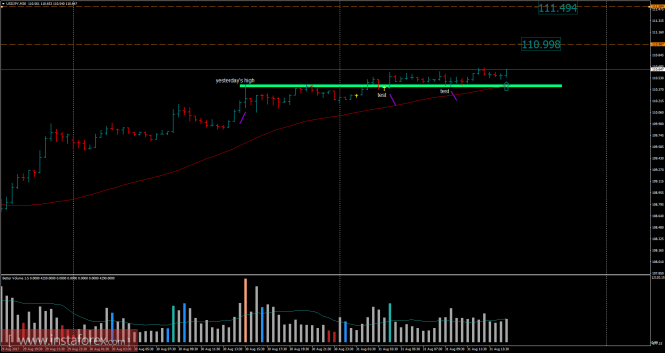
[color=black]USD/JPY analysis for August 31, 2017 [/color] https://forex-images.ifxdb.com/userfiles/20170831/analytics59a801116a2f9.png Recently, the USD/JPY pair has been upwards. The price tested the level of 110.65 in a high volume. According to the 30M time frame, I found successful testing of support in a low volume, which is a sign that buyers are in control. My advice is to watch for potential buying opportunities. The upward targets are set at the price of 111.00 and 111.50. The daily trend is bullish. Resistance levels: R1: 110.60 R2: 111.00 R3: 111.50 Support levels: S1: 109.70 S2: 109.15 S3: 108.80 Trading recommendations for today: watch for potential buying opportunities. Read more: https://www.instaforex.com/forex_analysis/97894 |
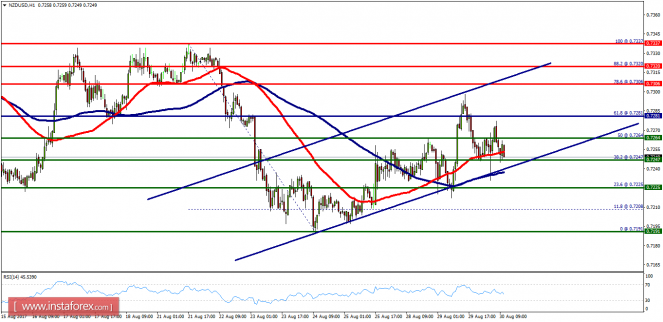
[color=black]Technical analysis of NZD/USD for August 30, 2017 [/color] https://forex-images.ifxdb.com/userfiles/20170830/1504084415_NZDUSDH1.png Overview: The NZD/USD pair bullish trend from the support levels of 0.7264 and 0.7247. Currently, the price is in a bullish channel. This is confirmed by the RSI indicator signaling that we are still in a bullish trending market. As the price is still above the moving average (100), immediate support is seen at 0.7264, which coincides with a golden ratio (50% of Fibonacci). Consequently, the first support is set at the level of 0.7264. So, the market is likely to show signs of a bullish trend around the spot of 0.7264/0.7247. Hence, buy above the levels of 0.7264/0.7247 with the first target at 0.7306 in order to test the daily resistance 1 and further to 0.7320. Also, it might be noted that the level of 0.7337 is a good place to take profit because it will form a double top. On the other hand, in case a reversal takes place and the NZD/USD pair breaks through the support level of 0.6274, a further decline to 0.7200 can occur which would indicate a bearish market. Overall, we still prefer the bullish scenario, which suggests that the pair will stay above the zone of 0.7247/0.7225 today. Read more: https://www.instaforex.com/forex_analysis/97778 |
[bResults of five InstaForex contests summed up/b] Today we will name the winners of the following contests: One Million Option, InstaForex Sniper, Lucky Trader, FX-1 Rally, and Real Scalping. FX-1 Rally TRI PUJI HARTANTO showed the best performance in the latest stage of the FX-1 Rally contest. The trader from Indonesia demonstrated great trading and racing skills. Congratulations to the winner and good luck in further steps! If you want to feel the thrilling spirit of the race, welcome to the start of another step of the FX-1 Rally contest. You can register for the nearest rally that will take place from 00:00 September 1, 2017 to 23:59 September 1, 2017. One Million Option One Million Option being one of the most well-liked contests gathers a lot of participants who fight hard for the title of the best option trader. The most outstanding result was shown by Kehinde Adetola Osonaike from Nigeria. The next stage of the contest will take place from August 28, 2017 to September 1, 2017. Lucky Trader If you manage to trade perfectly during two weeks, you will be able to win the Lucky Trader contest, just like Anna Gazizovna Mambetova did it. The trader showed excellent skills and the best result among hundreds of other contestants. We congratulate the winner with the victory and wish her luck in next competitions. The next stage of the Lucky Trader contest will be held from September 4, 2017 to September 15, 2017. InstaForex Sniper The sharpest and fastest traders compete in the InstaForex Sniper context. By the results of the recent step, Stanislav Grigorievich Kozlov became the winner. The next step will be held from August 28, 2017 to September 1, 2017. Real Scalping Short-term trading is a difficult activity requiring high attention and accuracy. Not everyone is attentive, focused and quick enough to make a right decision for this type of trading, but these qualities are needed to succeed in scalping. This time, Faraj Milad Alhadar took the first place in the Real Scalping contest. InstaForex congratulates the winner and invites other participants to test their luck once again. Everyone willing to challenge their skills may register in the next step that will start on September 4, 2017 and end on September 29, 2017. Learn more about contests Photos and comments of the finalists |
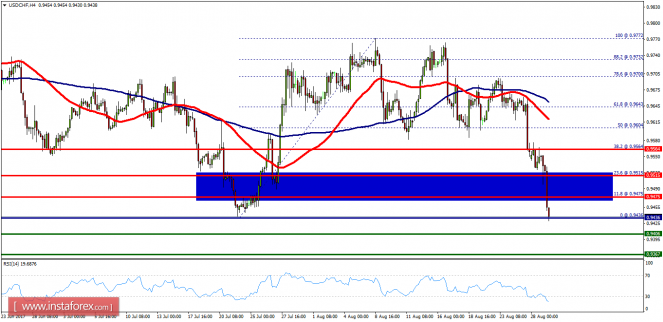
Technical analysis of USD/CHF for August 29, 2017 https://forex-images.ifxdb.com/userfiles/20170829/USDCHFH4.png Overview: The USD/CHF pair has faced strong resistances at the levels of 0.9475 because support had become resistance on August 29, 2017. So, the strong resistance has been already formed at the level of 0.9475 and the pair is likely to try to approach it in order to test it again. However, if the pair fails to pass through the level of 0.9475, the market will indicate a bearish opportunity below the new strong resistance level of 0.9475. Moreover, the RSI starts signaling a downward trend, as the trend is still showing strength above the moving average (100) and (50). Thus, the market is indicating a bearish opportunity below the area of 0.9475/0.9500 so it will be good to sell at 0.9475 with the first target of 0.9406. It will also call for a downtrend in order to continue towards 0.9367. The daily strong support is seen at 0.9367. However, the stop loss should always be taken into account, for that it will be reasonable to set your stop loss at the level of 0.9515. Read more: https://www.instaforex.com/forex_analysis/97679 |


