News And Technical Analysis From Instaforex - Business (14) - Nairaland
Nairaland Forum / Nairaland / General / Business / News And Technical Analysis From Instaforex (46334 Views)
Get Startup Bonus Of $500 To Trade From Instaforex / News And Technical Analysis From Superforex / News From Instaforex (2) (3) (4)
(1) (2) (3) ... (11) (12) (13) (14) (15) (16) (17) ... (23) (Reply) (Go Down)
| Re: News And Technical Analysis From Instaforex by Instaforexbuk(f): 2:27pm On Jun 19, 2018 |
Global macro overview for 19/06/2018 It is the lunchtime in Europe now, but the gloomy atmosphere denies to leave investors. The largest European indices remain in red, expressing concern about the speech made by President Donald Trump, during which he threatened to impose additional duties on Chinese products. On the plus side, however, it can be noted that for two hours you can see modest rebound attempts. The futures market on Wall Street has so far yielded less effective price drops than on European or Asian markets. Futures on the SP500 are only sliding by 0.2%, while futures from NASDAQ almost do not record changes in the exchange rate. In a similar condition is the German DAX, which dropped by about 1.5%. Beiersdorf was the only company listed in the DAX index to record increases during today's session. On the currency market, traders can observe increases in USD and JPY, which means the global investors are running to the so-called safe haven assets. Gold also has a price increase, but only by about 0.1%. These movements may be justified by the widespread fear of developing political disputes between China and the US. WTI oil erases yesterday's increases, which were the result of OPEC's less radical approach to raising the level of output, falling by more than 1 percent. and staying at the limit of USD 65 per barrel. The price of cotton falls another day, losing about 2.5%, leveling the levels at the end of May. Let's now take a look at the German DAX index technical picture at the H4 time frame. The market opened with a gap down this morning and so far made a low at the level of 12,600, which is a technical support for the price. Currently, the bulls are trying to fill the gap between the levels of 12,837 - 12,684, but so far no avail. The other obstacle on the road higher for bulls is the golden internal trend line, which is acting as a dynamic resistance. If the bulls will be too weak to move higher, the bears will push the price lower again towards the level of 12,547. Weak momentum and stochastic pointing to the downside support the bearish bias.  Read more: https://www.instaforex.com/forex_analysis/118851 |
| Re: News And Technical Analysis From Instaforex by Instaforexbuk(f): 12:51pm On Jun 20, 2018 |
Technical analysis on USDX for June 20, 2018 The Dollar index remains in a bullish trend. Price is near its 2018 highs. My longer-term view is bearish but there is no sign for a reversal yet. There are some warnings but no confirmed reversal sign yet. 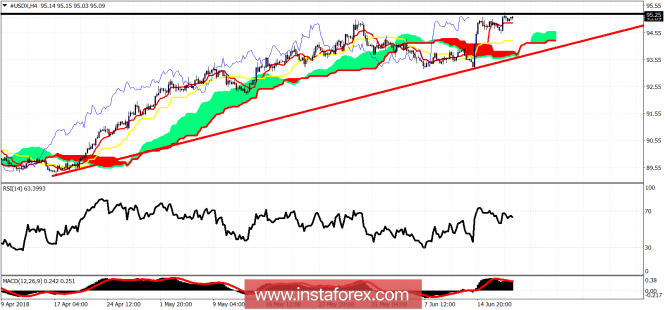 Black line - resistance Red line - support The Dollar index remains in a bullish trend. Price is above the Ichimoku cloud and above the red trend line support. Short-term support is found at 94.89. Resistance is at 95.30. The RSI is diverging despite the new higher highs. This is a bearish warning. Below 94.89 I would look to open short positions and increase them on a break below the cloud and the red trend line support. Read more: https://www.instaforex.com/forex_analysis/118917 |
| Re: News And Technical Analysis From Instaforex by Instaforexbuk(f): 3:01pm On Jun 21, 2018 |
Global macro overview for 21/06/2018 The Bank of England also should not change the policy parameters (interest rates, asset purchase program). Previous supporters of the hike (McCafferty and Saunders) should stay with their opinion, but the rest of the committee will keep its cautious approach. Data from the last meeting do not give clear indications that the second quarter brings such an important rebound after the weak start of the year. PMI indexes rebounded and prices in the industry are rising, but production in April collapsed. Nevertheless, BoE would probably like to make a hike before the settlements (or the confusion because of their absence) of Brexit negotiations, which will take place in October / November. For this reason, the hopes for a hike in August are not going away, but today's BoE is unlikely to suggest whether it is more or less real. However, even small changes in the content of the message regarding the assessment of economic activity may be significant for today's GBP behavior. Risk asymmetry shows an advantage in favor of the Pound, because the neutral statement will not disturb growing expectations for the August increase. The Bank of England is expected to hold the interest rate at 0.50%, together with Asset Purchase Facility at 435bln. The BoE decision is scheduled at 11:00 am GMT, together with Monetary Policy Summary release. Let's now take a look at the GBP/USD technical picture at the H4 time frame. The key technical resistance at the level of 1.3217 is still not violated as the bulls were too weak to break through it. Since then, the price has fallen towards the level of 1.3124 in a Falling Wedge formation. In a case of a further drop, the next important support is seen at the level of 1.3000 and this level might be very well defended by bulls. Please notice, the market conditions are now oversold on multiple timeframes and the momentum is still weak as it hovers below its fifty level. 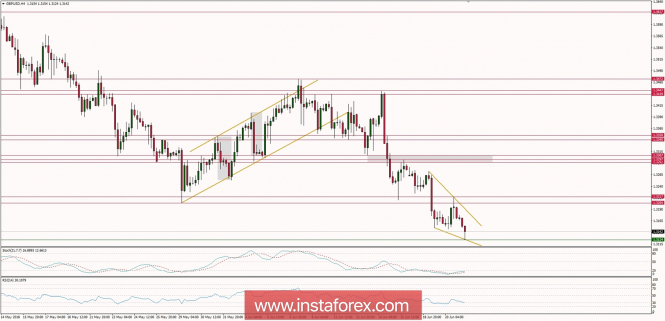 Read more: https://www.instaforex.com/forex_analysis/119042 |
| Re: News And Technical Analysis From Instaforex by Instaforexbuk(f): 11:48am On Jun 22, 2018 |
Elliott wave analysis of EUR/NZD for June 22, 2018 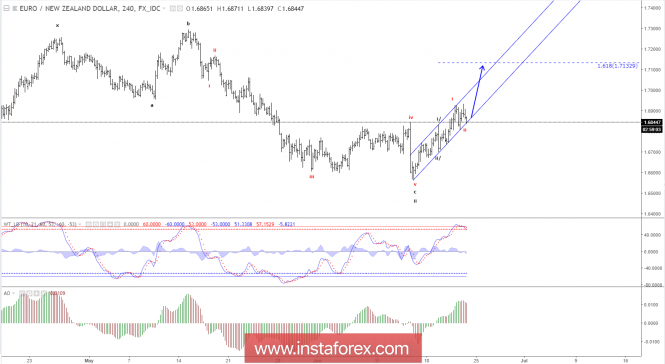 The minor correction we expected from 1.6921 moved slightly lower than expected and spiked down to 1.6806, but that does not change our outlook for a new impulsive rally soon towards 1.7133 and above. Short-term, we could see another minor spike to near 1.6806 before the next move higher should be expected. Only an unexpected break below support at 1.6737 will question our bullish outlook. R3: 1.7025 R2: 1.6964 R1: 1.6933 Pivot: 1.6890 S1: 1.6837 S2: 1.6784 S3: 1.6737 Trading recommendation: We are long EUR from 1.6815 with our stop placed at 1.6730. If you are not long EUR yet, then buy near 1.6806 or upon a break above 1.6933 and use the same stop at 1.6730. Read more: https://www.instaforex.com/forex_analysis/119107 |
| Re: News And Technical Analysis From Instaforex by Instaforexbuk(f): 1:59pm On Jun 25, 2018 |
Reluctantly, the Australian falls AUD / USD On Friday, the Australian dollar increased significantly, adding 63 points. This growth seems completely unjustified. OPEC + decided to increase production by 1 million barrels per day. True, the prices for raw materials have slightly increased, but the political situation is unlikely to give any further to this trend. US President Trump announced the development of new sanctions (or rather, tariffs and duties) for the Chinese economy. 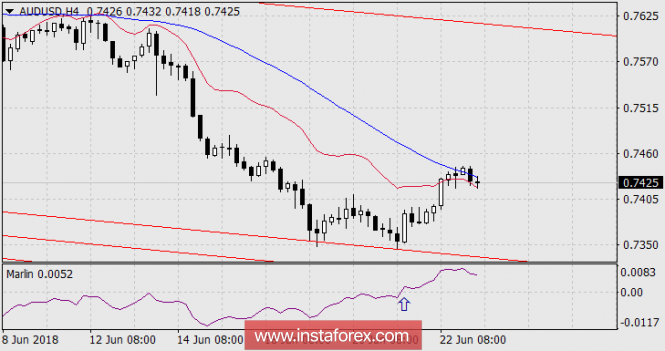 On the chart of H4, the price could not gain a foothold over the Kruzenshtern blue line, which could push the price back under the balance sheet. In this case, the output of the Marlin oscillator signal line to the positive zone (marked with an arrow) can be completed. To return the price under the balance sheet and the indicator Marlin in the negative zone (the reduction zone) will take time and effort of the market. This effort can be expressed in a horizontal trend. The price reduction to support the trend line (0.7327) may take three days. 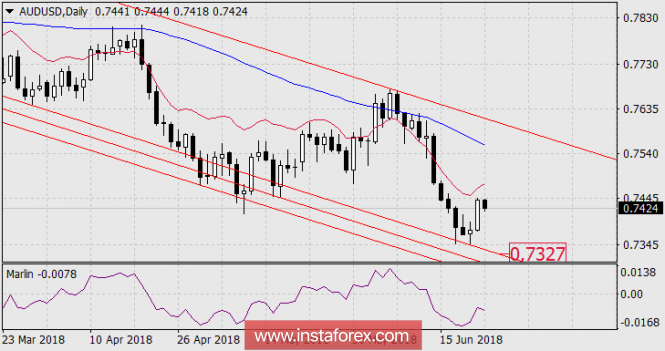 |
| Re: News And Technical Analysis From Instaforex by Instaforexbuk(f): 7:58am On Jun 26, 2018 |
Elliott wave analysis of EUR/JPY for June 26, 2018 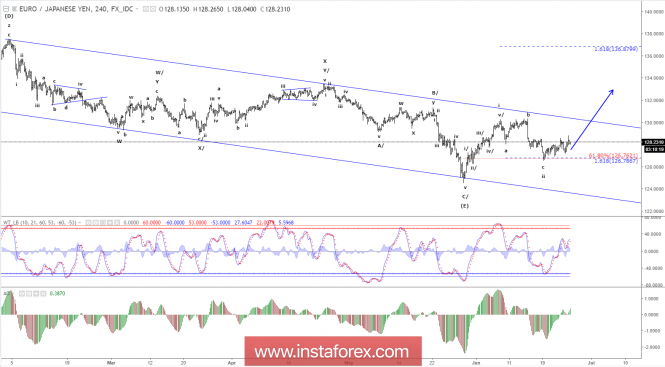 EUR/JPY is working its way higher, but we would like to see some real upside acceleration soon. A clear break above resistance at 128.60 should be able to provide the upside acceleration we are looking for towards 130.53 and above here confirms continuation towards the 136.88 target. Support is now seen at 128.04 and again at 127.85. The later will ideally be able to protect the downside for the next attack of resistance at 128.60. R3: 129.45 R2: 128.96 R1: 128.60 Pivot: 128.43 S1: 128.04 S2: 127.85 S3: 127.66 Trading recommendation: We are long EUR at 128.15. We will move our stop slightly higher to 127.20. If you are not long EUR yet, then buy EUR in the 127.85 - 128.05 zone or upon a break above 128.60 and use the same stop at 127.20. Read more: https://www.instaforex.com/forex_analysis/119272 |
| Re: News And Technical Analysis From Instaforex by Instaforexbuk(f): 6:34am On Jun 27, 2018 |
Elliott wave analysis of EUR/NZD for June 27, 2018 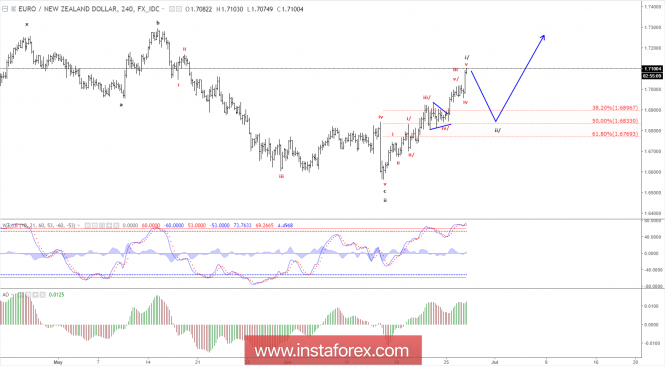 EUR/NZD took the more bullish alternate count and rallied directly higher. The first target at 1.7070 has already been exceeded opening for a continuation higher towards 1.7130 and even closer to 1.7240 if red wave v extends. Support is now seen at 1.7016 and only a break below here, will confirm that wave i/ has completed and wave ii/ towards 1.6833 is developing. R3: 1.7240 R2: 1.7185 R1: 1.7130 Pivot: 1.7073 S1: 1.7041 S2: 1.7016 S3: 1.6960 Trading recommendation: After taking 50% profit at 1.7000 yesterday, we are still 50% long EUR from 1.6815. We will raise our stop to 1.7010. Read more: https://www.instaforex.com/forex_analysis/119349 |
| Re: News And Technical Analysis From Instaforex by Instaforexbuk(f): 10:32am On Jun 28, 2018 |
Elliott wave analysis of EUR/JPY for June 28, 2018 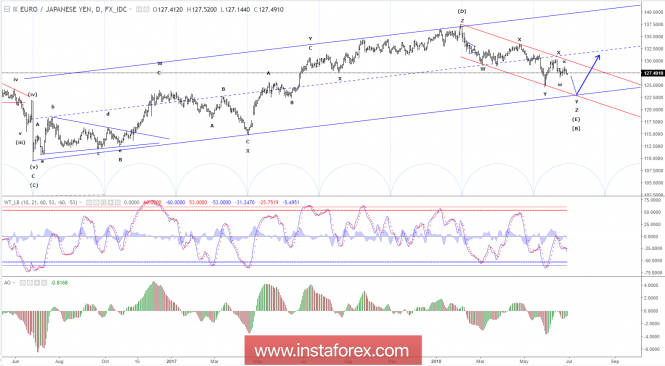 We have expressed our caution the last couple of days, as EUR/JPY has failed to accelerate higher. With the break below support at 127.24, our bullish outlook has been invalidated and we have had to review our larger count. The new top-count shows that wave (E) of the huge triangle consolidation that has been developing since July 2008 still is developing, within a triple zig-zag correction and that wave Z lower to near 123.52 still should be seen. A decline to 123.52 will also be a 50% correction of wave (D). Resistance is now seen at 127.88 and again at 128.24. R3: 128.84 R2: 128.24 R1: 127.88 Pivot: 127.55 S1: 127.12 S2: 126.97 S3: 126.61 Trading recommendation: Our stop at 127.20 was hit. We will stand aside for now. Read more: https://www.instaforex.com/forex_analysis/119420 |
| Re: News And Technical Analysis From Instaforex by horlajumokhe(f): 2:58pm On Jun 29, 2018 |
Hello good day please I want to verify my account please provide me the link to verify my account |
| Re: News And Technical Analysis From Instaforex by Instaforexbuk(f): 3:07pm On Jun 29, 2018 |
AUD/CAD Testing Major Support, Look For The Bounce AUD/CAD is testing major support at 0.9737 (Fibonacci retracement, Fibonacci extension, horizontal swing low support) and a strong bounce could occur at this level to push prices all the way up to major resistance at 0.9809 (Fibonacci retracement, horizontal overlap resistance). Stochastic (34,5,3) is seeing strong support above 5.8% where a corresponding bounce could occur. Buy above 0.9737. Stop loss at 0.9698. Take profit at 0.9809. 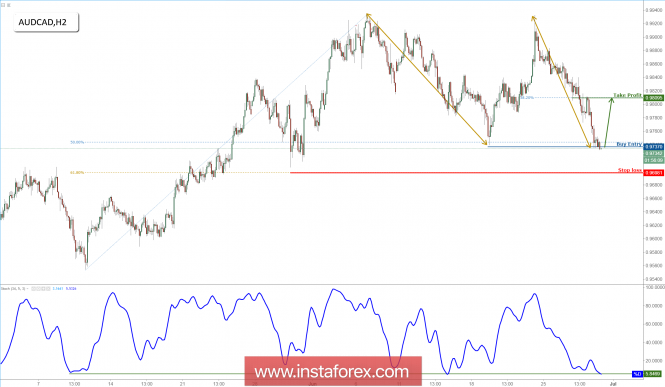 Read more: https://www.instaforex.com/forex_analysis/119506 |
| Re: News And Technical Analysis From Instaforex by Instaforexbuk(f): 3:15pm On Jun 29, 2018 |
horlajumokhe: You can upload the document for verification within this link - https://cabinet.instaforex.com/client/client_verification The process can take up to 72 working hours (Monday-Friday). You will get the notification by email after it is approved. |
| Re: News And Technical Analysis From Instaforex by Instaforexbuk(f): 7:34am On Jul 02, 2018 |
Technical analysis of USDX for July 02, 2018 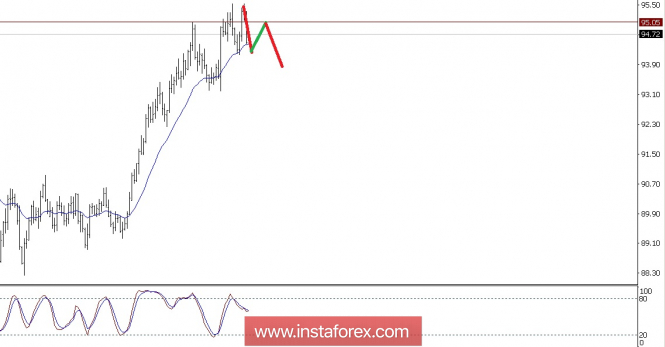 USD Index at Daily Charts seems meeting its strong Resistance level at 95.05, and this level looks like a good barrier for the USDX to continue going up, in a few days ahead there is a possibility the USDX will go down to test 94.67 as its first target and the 93.19 as its secondary target as long as the USDX does not break out and closes above 95.53. (Disclaimer) *The market analysis posted here is meant to increase your awareness, but not to give instructions to make a trade* Read more: https://www.instaforex.com/forex_analysis/119576 |
| Re: News And Technical Analysis From Instaforex by Instaforexbuk(f): 8:47am On Jul 03, 2018 |
Technical analysis of Crude Oil for July 03, 2018 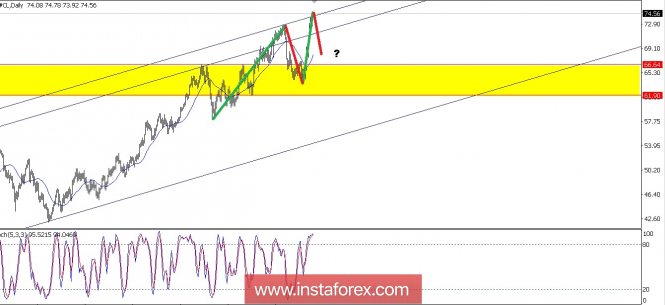 If we look at the Daily Charts, we will see that the Crude Oil bias is in a Bullish condition, but it seems already overbought this situation. The price is already at the top of the up channel and the Stochastic Oscillator is already at the overbought level too, basing on this fact in a few days ahead there is a possibility for the #CL to get a down correction to the Moving Average Period 21 or to the (RBS) Resistance Become Support Zone at 61.90-66.64 level. Read more: https://www.instaforex.com/forex_analysis/119658 |
| Re: News And Technical Analysis From Instaforex by Instaforexbuk(f): 7:20am On Jul 04, 2018 |
Technical analysis of Ethereum for July 04, 2018 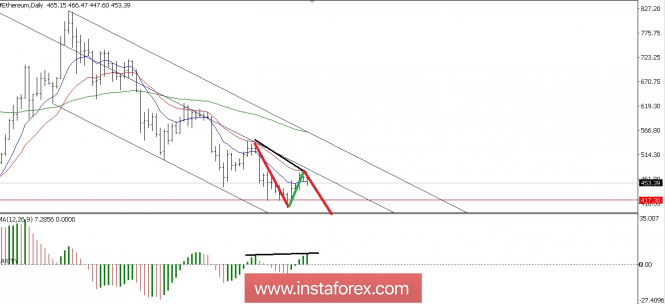 The Ethereum at Daily Charts looks like still continuing its Bearish bias. This is already confirmed by the price moving in a down slope channel and we've spotted the hidden Divergence between the MACD Histogram and the price, so the tendency of this Cryptocurrency still continues its downtrend. (Disclaimer) *The market analysis posted here is meant to increase your awareness, but not to give instructions to make a trade. Read more: https://www.instaforex.com/forex_analysis/119730 |
| Re: News And Technical Analysis From Instaforex by Instaforexbuk(f): 7:55am On Jul 05, 2018 |
Fundamental Analysis of AUD/USD for July 5, 2018 AUD/USD has been quite impulsive with the bearish gains today after rejecting off the dynamic level of 20 EMA yesterday with a daily close. Whereas AUD has been struggling with the recent economic reports, Trade War tension has got into USD ahead of the upcoming NFP report this Friday. Recently AUD Retail Sales report was published with better than expected value at 0.4% decrease from the previous value of 0.5% but a slightly better than expectation of 0.3% and Trade Balance report failed to meet the expectation with the actual figure of 0.83B increasing from the previous figure of 0.47B which was expected to be at 1.21B. On the other hand, ahead of the NFP report tomorrow, today Challenger Job Cuts report is going to be published today which previous was at -4.8% with no expectation so far, ADP Non-Farm Employment Change report is expected to increase to 190k from the previous figure of 178k, Unemployment Claims is expected to decrease to 225k from the previous figure of 227k, Final Services PMI is expected to be unchanged at 56.5 and ISM Non-Manufacturing PMI report is expected to have slight decrease to 58.3 from the previous figure of 58.6. Moreover, today FOMC Meeting Minutes is going to be held which is expected to have a higher impact on the USD momentum this week. As of the current scenario, USD is expected to have an upper hand over AUD in the coming days despite the AUD mixed economic reports published recently. Though certain volatility may occur in the process market is still not anti USD biased by now for the Trade War for which certain gains may be observed on the USD side for the coming days. Now let us look at the technical view. The price is currently residing at the edge of 0.7350 area from where it is expected to push much lower towards 0.72 area in the coming days. The trend has been a bit non-volatile recently for which expected impulsive momentum is yet to be observed in the pair. As the price remains below the dynamic level of 20 EMA and 0.7500-50 area, the bearish bias is expected to continue further. NEAREST RESISTANCE: 0.7500-50 NEAREST SUPPORT: 0.7250 BIAS: BEARISH MOMENTUM: IMPULSIVE VOLATILE 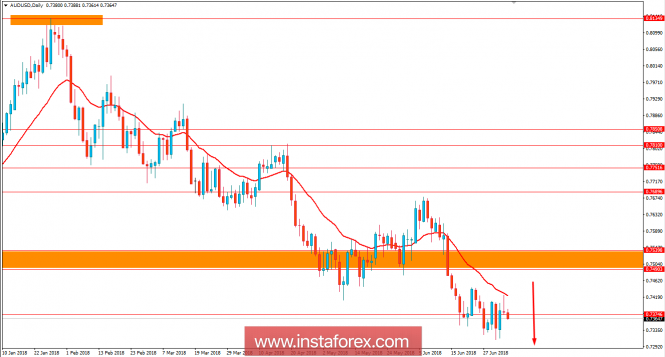 Read more: https://www.instaforex.com/forex_analysis/119803 |
| Re: News And Technical Analysis From Instaforex by Instaforexbuk(f): 6:44am On Jul 06, 2018 |
Technical analysis: Intraday Level For EUR/USD, July 06, 2018 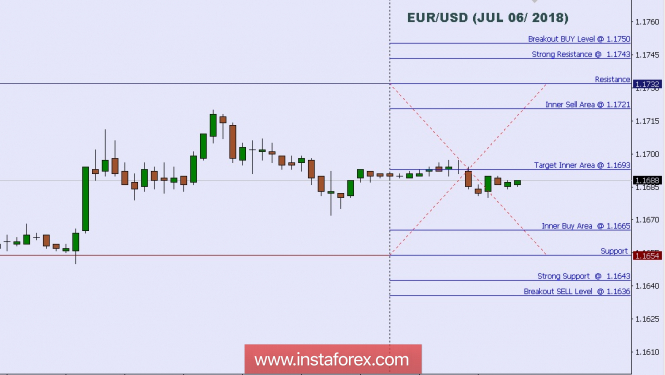 When the European market opens, some Economic Data will be released such as Italian Retail Sales m/m, French Trade Balance, and German Industrial Production m/m. The US will release the Economic Data too, such as Natural Gas Storage, Trade Balance, Unemployment Rate, Non-Farm Employment Change, and Average Hourly Earnings m/m, so, amid the reports, EUR/USD will move in a medium to high volatility during this day. TODAY'S TECHNICAL LEVEL: Breakout BUY Level: 1.1750. Strong Resistance:1.1743. Original Resistance: 1.1732. Inner Sell Area: 1.1721. Target Inner Area: 1.1665. Inner Buy Area: 1.1633. Original Support: 1.1654. Strong Support: 1.1643. Breakout SELL Level: 1.1636 . Disclaimer: Trading Forex (foreign exchange) on margin carries a high level of risk, and may not be suitable for all Traders or Investors. The high degree of leverage can work against you as well as for you. Before deciding to invest in foreign exchange you should carefully consider your investment objectives, level of experience, and risk appetite. The possibility exists that you could sustain a loss of some or all of your initial investment and therefore you should not invest money that you cannot afford to lose. You should be aware of all the risks associated with foreign exchange trading, and seek advice from an independent financial advisor if you have any doubts. Read more: https://www.instaforex.com/forex_analysis/119876 |
| Re: News And Technical Analysis From Instaforex by Instaforexbuk(f): 7:45am On Jul 11, 2018 |
Technical analysis: Intraday Level For EUR/USD, July 11, 2018 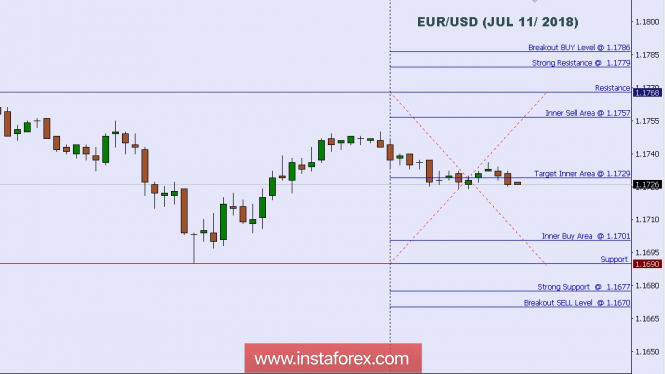 When the European market opens, some Economic Data will be released such as German 10-y Bond Auction. The US will also release the Economic Data such as Crude Oil Inventories, Final Wholesale Inventories m/m, PPI m/m, and Core PPI m/m, so amid the reports, EUR/USD will move in a low to medium volatility during this day. TODAY'S TECHNICAL LEVEL: Breakout BUY Level: 1.1786. Strong Resistance:1.1779. Original Resistance: 1.1768. Inner Sell Area: 1.1757. Target Inner Area: 1.1729. Inner Buy Area: 1.1701. Original Support: 1.1690. Strong Support: 1.1677. Breakout SELL Level: 1.1670. Disclaimer: Trading Forex (foreign exchange) on margin carries a high level of risk, and may not be suitable for all Traders or Investors. The high degree of leverage can work against you as well as for you. Before deciding to invest in foreign exchange you should carefully consider your investment objectives, level of experience, and risk appetite. The possibility exists that you could sustain a loss of some or all of your initial investment and therefore you should not invest money that you cannot afford to lose. You should be aware of all the risks associated with foreign exchange trading, and seek advice from an independent financial advisor if you have any doubts. Read more: https://www.instaforex.com/forex_analysis/120096 |
| Re: News And Technical Analysis From Instaforex by Instaforexbuk(f): 7:15am On Jul 12, 2018 |
Trading Plan for EUR/USD for July 12, 2018 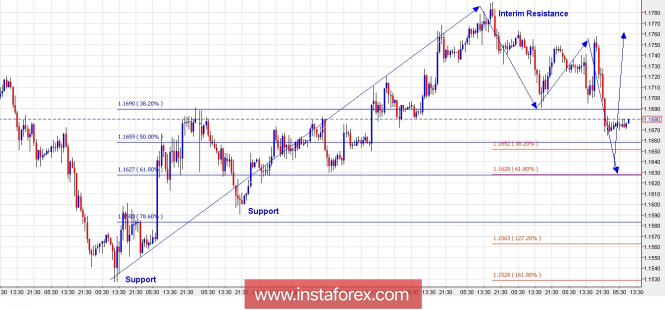 Technical outlook: The hourly EUR/USD chart presented here indicates that the currency pair is dropping in a corrective manner since printing highs at the 1.1790 levels recently. At this point in time, prices are finding support at a past resistance turned support zone around the 1.1660/70 levels. According to the Fibonacci extensions displayed here, it remains quite possible for the pair to drop through the 1.1650/30 levels to find further support before turning higher. The price support is seen at the 1.1590 levels, followed by the 1.1530 levels, respectively, while interim resistance is seen at the 1.1790 levels. Most probable direction is to push higher at least one last time towards 1.1850 and above, before reversing lower again. Please note that in the medium term, till the prices remain below the 1.2150 levels, bears shall be in complete control. Trade plan: Aggressive traders, now look to buy again between the 1.1630/60 levels, with stop below 1.1550 and target above 1.1850. Fundamental outlook: Watch out for USD CPI at 0800 AM EST today. Good luck! Read more: https://www.instaforex.com/forex_analysis/120162 |
| Re: News And Technical Analysis From Instaforex by Instaforexbuk(f): 7:32am On Jul 13, 2018 |
Trading Plan for US Dollar Index for July 13, 2018 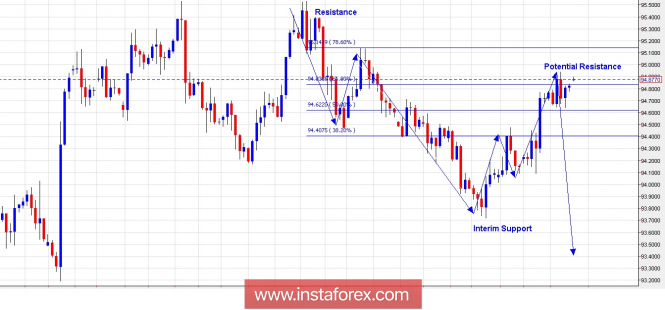 Technical outlook: The US Dollar Index is seen to be trading around the potential resistance zone at the 94.80/95.00 levels. Also please note the Fibonacci 0.618 resistance passing through the 94.85 levels as depicted here. A bearish turn seems to be the high probable move from here, bottom line prices should remain below the 95.50 levels for now. Also note that the US Dollar Index might be working on wave (4) of a higher degree and until prices stay above the 91/92 levels, the count remains valid. For now, bears should be back in control from around these levels and continue to drag prices below 93.80 at least. On the flip side, if resistance at 95.50 is taken off, it would mean that bulls are targeting the 98.00 levels before taking a meaningful correction. Trading plan: Remain short from here, stop above 95.50, target at 93.00. Fundamental Outlook: Watch out for USD U. Michigan at 1000 AM EST, followed by Fed Monetary Policy to Congress at 1100 AM EST. Good luck! Read more: https://www.instaforex.com/forex_analysis/120250 |
| Re: News And Technical Analysis From Instaforex by Instaforexbuk(f): 7:26am On Jul 16, 2018 |
Elliott wave analysis of EUR/NZD for July 16, 2018 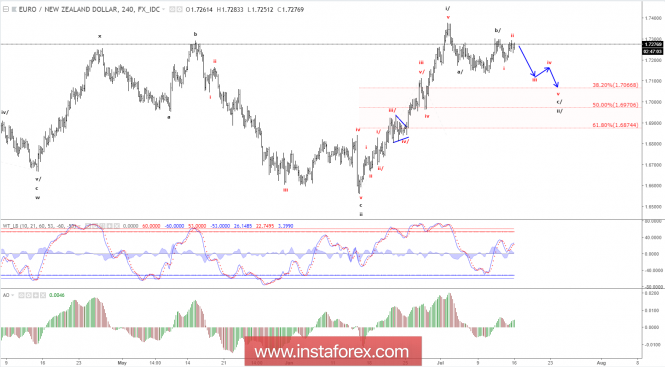 Wave i/ peaked at 1.7479 and the ongoing correction in wave ii/ will ideally make it lower to the 38.2% support at 1.7067 before turning higher in wave iii/ towards 1.8638. Short-term a break below minor support at 1.7238 confirms more corrective downside pressure towards 1.7112 and ideally towards the 38.2% corrective target at 1.7067 to complete wave ii/ and set the stage for the next upside attack in wave iii/ towards 1.8638. R3: 1.7379 R2: 1.7320 R1: 1.7299 Pivot: 1.7238 S1: 1.7200 S2: 1.7181 S3: 1.7139 Trading recommendation: We will wait for a buying opportunity near 1.7067 Read more: https://www.instaforex.com/forex_analysis/120297 |
| Re: News And Technical Analysis From Instaforex by Instaforexbuk(f): 7:18am On Jul 17, 2018 |
Elliott wave analysis of EUR/JPY for July 17, 2018 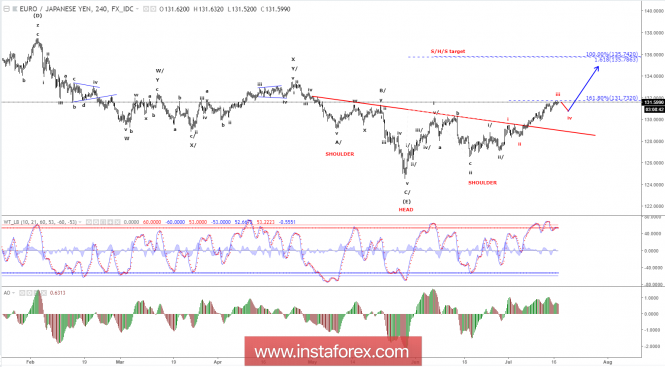 EUR/JPY is now testing the 161.8% extension target for red wave iii and a correction should be expected anytime towards 130.87 and maybe even closer to 130.59 in red wave iv, before red wave v will be ready to take over, for a continuation higher towards 133.49 and the ideal target for black wave iii/ at 137.68. Our preferred long-term count shows that a huge [B] wave triangle completed with the test of 124.59 and wave [C] to above 169.97 now is developing. As we still are in the very early stages of this [C] wave higher, the waves will be less clear, but as wave [C] builds it will become easier to extract the larger waves. R3: 132.54 R2: 132.11 R1: 131.63 Pivot: 131.41 S1: 131.24 S2: 131.08 S3: 130.87 Trading recommendation: We will use the coming correction in red wave iv to buy EUR. Ideally as close to 130.10 as possible. Read more: https://www.instaforex.com/forex_analysis/120367 |
| Re: News And Technical Analysis From Instaforex by Instaforexbuk(f): 7:04am On Jul 18, 2018 |
Wave analysis of EUR / USD pair for July 17. Meeting of leaders of the US and Russia did not affect the pair 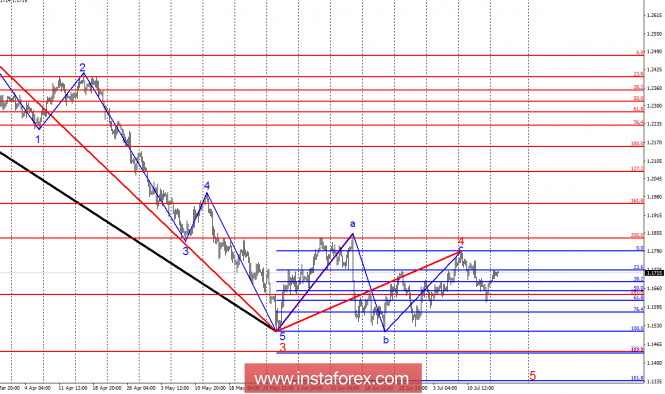 Analysis of wave counting: During the Monday session, the EUR/USD pair gained about 20 bp, counting the close of the day. Thus, the pair remains within the framework of the proposed wave 5 of the downward trend section. If this is the case, then the construction of an internal correction wave in the future has begun. On this basis, the decline in quotations should resume in the near future. The absence of breakdown of the maximum wave 4, in 3, the maximum wave a, in 4 indicates the preservation of the downward sentiment in the foreign exchange market. A successful attempt to break through the high of July 9 will require us in refining the wave count. Goals for sales: 1.1510 - 100.0% by Fibonacci 1.1433 - 127.2% Fibonacci retracement Goals for shopping: 1.1866 - 100.0% Fibonacci retracements 1.2072 - 127.2% by Fibonacci General conclusions and trading recommendations: There is every reason to assume completion of the wave construction at 4th in c. Thus, it is recommended to continue selling the pair with the first targets near the estimated marks of 1.1510 and 1.1433, which corresponds to 100.0% and 127.2% of Fibonacci. Moreover, I recommend buying the pair only after a successful attempt to break the maximum of the assumed wave c at 4th. Then the pair can proceed to a more extensive formation of the ascending set of waves. Read more: https://www.instaforex.com/forex_analysis/209750 |
| Re: News And Technical Analysis From Instaforex by Instaforexbuk(f): 6:53am On Jul 19, 2018 |
Elliott wave analysis of EUR/NZD for July 19, 2018 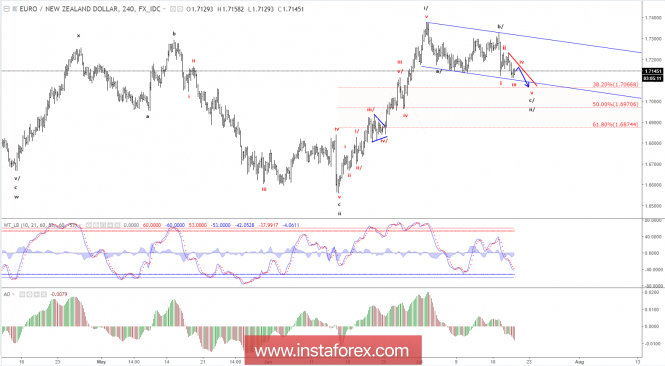 The wave ii/ correction towards at least 1.7067 is developing as expected. Wave c/ of ii/ is most likely shaping up to be an ending diagonal, meaning that resistance should be expected near 1.7182 for the final leg lower to the corrective target at 1.7067 from where a new impulsive rally is expected. Only a direct break above resistance at 1.7236 will indicate a premature completion of wave c/ and ii/ for the next rally higher towards 1.7668 and 1.7979 as the next upside targets. R3: 1.7298 R2: 1.7236 R1: 1.7182 Pivot: 1.7136 S1: 1.7116 S2: 1.7067 S3: 1.7026 Trading recommendation: We will buy EUR at 1.7075 or upon a break above resistance at 1.7236 Read more: https://www.instaforex.com/forex_analysis/120522 |
| Re: News And Technical Analysis From Instaforex by Instaforexbuk(f): 7:43am On Jul 20, 2018 |
Elliott wave analysis of EUR/JPY for July 20, 2018 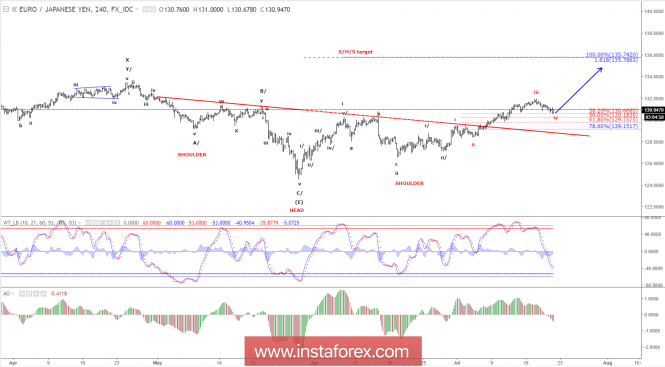 EUR/JPY has dipped just below the target seen at 130.67 (the low has been seen at 130.59), this is enough to fulfill the red wave iv target and set the stage for a new impulsive rally higher in red wave v towards the 133.02 - 133.60 area. To confirm that red wave iv has completed, we need to see resistance at 131.50 be broken, which will confirm red wave v is building. This also means, that as long as this resistance is able to cap the upside, a deeper correction in red wave iv remains possible towards 130.18. R3: 131.98 R2: 131.50 R1: 131.22 Pivot: 130.59 S1: 130.18 S2: 129.88 S3: 129.59 Trading recommendation: We have bought EUR at 130.80 and we will place our stop at 129.80. If you are not long EUR yet, then buy a break above 131.22 or more conservative a break above 131.50 and start by using the same stop at 129.80. Read more: https://www.instaforex.com/forex_analysis/120600 |
| Re: News And Technical Analysis From Instaforex by Instaforexbuk(f): 7:37am On Jul 23, 2018 |
Fundamental Analysis of AUD/USD for July 23, 2018 AUD/USD has been quite corrective and volatile between the price range of 0.73 to 0.75 area which is still expected to push lower in the coming days as of the trend momentum. AUD has been quite positive with the recent gains against USD which is expected to last for short-term. Ahead of the high impact economic reports to be published on Thursday this week including CPI report which is expected to show an increase to 0.5% from the previous value of 0.4% and Trimmed Mean CPI report is expected to be unchanged at 0.5%. Today AUD CB Leading Index report is going to be published which previously was at 0.1% and expected to have an optimistic outcome. On the other hand, this week Core Durable Goods report is going to be published on Thursday which is expected to increase to 0.5% from the previous value of 0.0% and Average GDP report on Friday is expected to increase to 4.0% from the previous value of 2.0. Today Existing Home Sales report is going to be published which is expected to have a slight increase to 5.46M from the previous figure of 5.43M. As of the current scenario, both currencies in this pair are quite optimistic with the upcoming economic reports which might lead to further volatility in the pair but USD may have an upper hand over AUD having bigger gap in the forecasts with more optimism in the market sentiment. Now let us look at the technical view. The price has recently bounced off the 0.73 support area from where it might show certain bullish momentum but as the price remains below 0.75 the bearish bias is expected to continue and push the price lower towards 0.7050 in the coming days. On the other hand, a break above 0.75 with a daily close is expected to inject bullish momentum in the pair with target towards 0.77 area in the future. RESISTANCE: 0.75, 0.77 SUPPORT: 0.73, 0.7050 BIAS: BEARISH MOMENTUM: CORRECTIVE AND VOLATILE 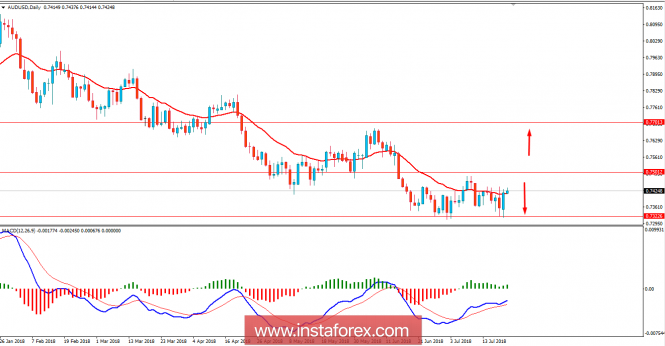 Read more: https://www.instaforex.com/forex_analysis/120684 |
| Re: News And Technical Analysis From Instaforex by Instaforexbuk(f): 7:32am On Jul 24, 2018 |
Elliott wave analysis of EUR/NZD for July 24, 2018 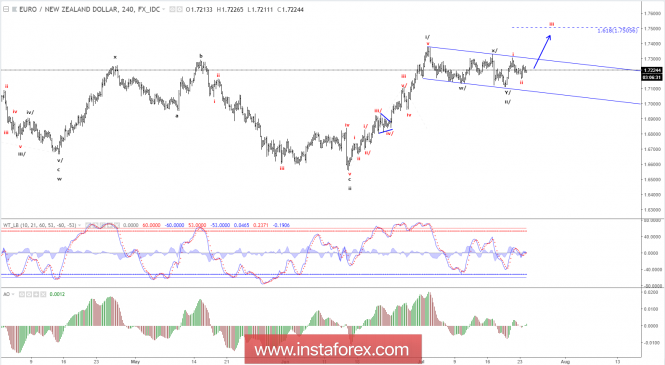 We continue to look for more upside pressure through resistance at 1.7268 and more importantly through resistance at 1.7305, that calls for red wave iii towards 1.7505 on the way higher towards 1.8381. Support is now seen at 1.7206 and again at 1.7170. Ideally the later will be able to protect the downside for the expected break above 1.7268. R3: 1.7305 R2: 1.7268 R1: 1.7232 Pivot: 1.7208 S1: 1.7184 S2: 1.7164 S3: 1.7144 Trading recommendation: We are long EUR at 1.7226 with our stop placed at 1.7110. If you are not long EUR yet, then buy EUR upon a break above 1.7268 and start by using the same stop at 1.7110. Read more: https://www.instaforex.com/forex_analysis/120763 |
| Re: News And Technical Analysis From Instaforex by Instaforexbuk(f): 7:21am On Jul 25, 2018 |
Elliott wave analysis of EUR/JPY for July 25, 2018 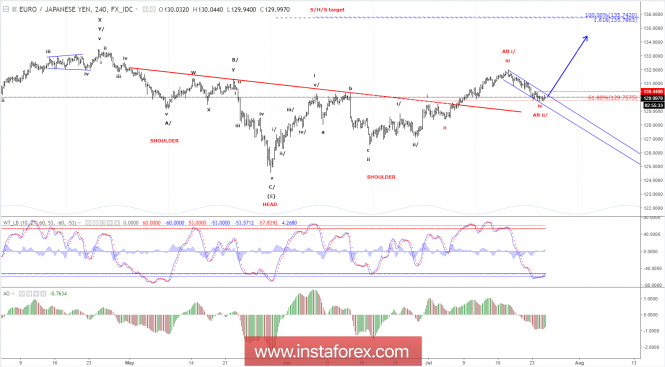 EUR/JPY has traded within a very narrow 47 pips band the last couple of days. We expect a bottoming process to be developing and it should just be a matter of time, before EUR/JPY breaks above resistance at 130.44 confirming that a bottom is in place for the red wave ii and that the red wave iii towards 133.60 is developing. That said, we also need to be aware, that as long as resistance at 130.44 is able to cap the upside, the possibility of a spike low persists. If such a spike is seen, it should be short-lived and will likely not move below 129.44. R3: 131.05 R2: 130.75 R1: 130.44 Pivot: 130.27 S1: 130.01 S2: 129.75 S3: 129.44 Trading recommendation: We will buy EUR upon a break above 130.44. Our stop will be placed 10 pips below the most recent low. Read more: https://www.instaforex.com/forex_analysis/120852 |
| Re: News And Technical Analysis From Instaforex by Instaforexbuk(f): 6:54am On Jul 26, 2018 |
Elliott wave analysis of EUR/NZD for July 26, 2018 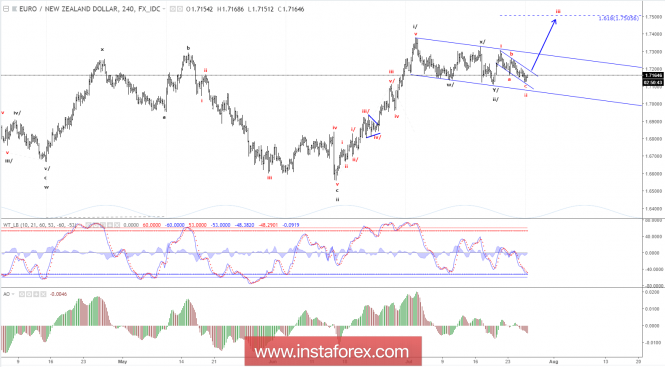 The ongoing correction in red wave ii keeps pushing lower, but it must not break below the start of red wave i at 1.7116 as a break below here, will confirm that black wave ii still is in motion and is headed for support at 1.7066. If, however, the low of red wave i at 1.7116 stays untouched, as we expected, for a break above the channel resistance near 1.7199, that will call for red wave iii towards 1.7510 on the way towards the first long-term target at 1.8381. R3: 1.7305 R2: 1.7268 R1: 1.7199 Pivot: 1.7184 S1: 1.7165 S2: 1.7130 S3: 1.7116 Trading recommendation: We are long EUR from 1.7226 with our stop placed at 1.7110. If you are not long EUR yet, then buy a break above the channel-resistance at 1.7199 and use the same stop at 1.7110. Read more: https://www.instaforex.com/forex_analysis/120939 |
| Re: News And Technical Analysis From Instaforex by Instaforexbuk(f): 7:58am On Jul 27, 2018 |
Fundamental Analysis of AUD/JPY for July 27, 2018 AUD/JPY has been residing inside the range between 80.50 to 84.50 for a few months now and currently, the price is expected to push lower towards the support area of 80.50 in the coming days. Despite the recent worse economic reports, JPY managed to maintain its momentum over AUD and expected to extend it further in the coming days. AUD has been performing quite well with the economic reports but failed to meet the stamina it needed for standing against the impulsive JPY gains in the process. Today AUD PPI report was published with a decrease to 0.3% which was expected to be unchanged at 0.5%. After the positive increase in AUD Import Prices to 3.2% from the previous value of 2.0%, today's economic report pushed the market to further indecision against JPY. On the JPY side, having a series of mixed economic reports this week, today JPY Tokyo Core CPI report was published with an increase to 0.8% which was expected to be unchanged at 0.7%. As of the current scenario, the indecision and corrective momentum is expected to continue further as the mixed economic reports on the both currency in the pair struggles. Though AUD has been quite positive earlier but JPY managed to maintain that positive attitude to sustain the gains it managed throughout the previous days of the market but the indecision and volatile is still expected to exist in the market until the range boundary is broken with a daily close. Now let us look at the technical view. The price is currently residing below the dynamic level of 20 EMA while residing below 84.50 area and a recent lower high in the process. Yesterday's bearish candle was quite powerful as it engulfed the previous bullish candles with an ease which also indicates upcoming bearish momentum in the process. As the price remains below 84.50 with a daily close, the bearish bias is expected to continue in this pair as the long-term trend is also bearish. SUPPORT: 80.50 RESISTANCE: 84.50 BIAS: BEARISH MOMENTUM: IMPULSIVE 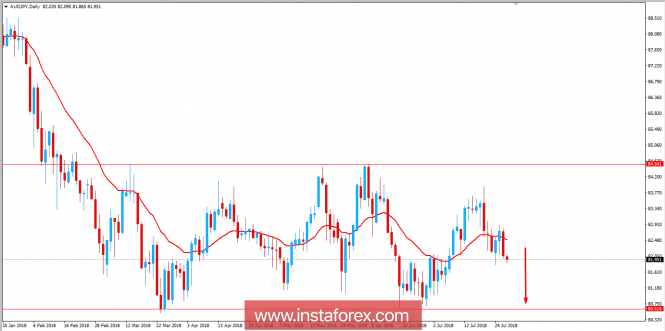 Read more: https://www.instaforex.com/forex_analysis/121018 |
| Re: News And Technical Analysis From Instaforex by Instaforexbuk(f): 7:20am On Jul 30, 2018 |
Elliott wave analysis of EUR/JPY for July 30, 2018 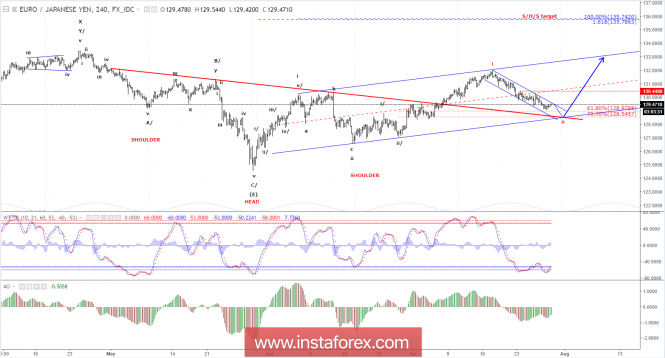 EUR/JPY remains lock inside the descending channel towards the 128.55 - 128.98 target area. Once this area is tested red wave ii is expected to complete and a new impulsive rally in red wave iii should take over for a rally towards 135.74. Short-term resistance is seen at 129.65 and again at 130.28. A break above the later will be a strong indication that red wave ii has completed and that red wave iii is developing. R3: 130.28 R2: 130.03 R1: 126.65 Pivot: 129.35 S1: 129.09 S2: 128.98 S3: 128.55 Trading recommendation: We will buy EUR at 128.60 or upon a break above 130.28. Read more: https://www.instaforex.com/forex_analysis/121091 |
| Re: News And Technical Analysis From Instaforex by Instaforexbuk(f): 6:55am On Jul 31, 2018 |
Elliott wave analysis of EUR/JPY for July 31, 2018 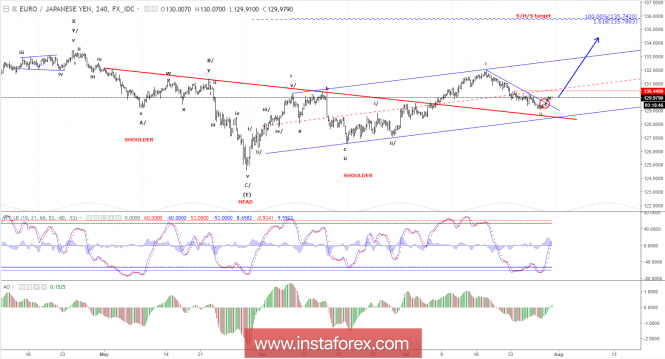 EUR/JPY found support near the 61.8% corrective target at 128.98 (the low was seen at 129.09). The following break above the channel resistance-line indicates that red wave ii has completed and red wave iii now is developing. To confirm this is the case, we still need a clear break above resistance at 130.44. A clear break above here will call for a rally towards 135.74. Support is now seen at 129.84 and again at 129.43. Ideally the later will protect the downside for a test and break above resistance at 130.44. R3: 130.74 R2: 130.44 R1: 130.10 Pivot: 129.84 S1: 129.43 S2: 129.09 S3: 128.55 Trading recommendation: We will buy EUR at 129.55 or upon a break above 130.28. Read more: https://www.instaforex.com/forex_analysis/121180 |
| Re: News And Technical Analysis From Instaforex by Instaforexbuk(f): 6:57am On Aug 01, 2018 |
Elliott wave analysis of EUR/JPY for August 1, 2018  EUR/JPY has rallied nicely of the 129.09 low and the break above resistance at 130.44 confirmed that red wave ii has completed and red wave iii now is developing towards 135.74 and higher longer term. The next resistance to look for is seen at 131.71. Once broken the way higher to 135.74 should be right open. Support is now seen at 130.24 and again at 129.68. The later should be able to protect the downside for the expected test and break above 131.71. R3: 131.71 R2: 131.49 R1: 131.15 Pivot: 130.41 S1: 130.24 S2: 130.05 S3: 129.68 Trading recommendation: We are long EUR from 130.28 and we have placed our stop at 129.50. If you are not long EUR yet, then buy near 130.24 and use the same stop at 129.50. Read more: https://www.instaforex.com/forex_analysis/121273 |
(1) (2) (3) ... (11) (12) (13) (14) (15) (16) (17) ... (23) (Reply)
Femi Otedola And His Wife With Bill Gates / Photo: See The Lagos Taxi Driver That Uses POS / Chinese Man Speaking Complete Igbo To His Nigerian Customer In China(pics)
(Go Up)
| Sections: politics (1) business autos (1) jobs (1) career education (1) romance computers phones travel sports fashion health religion celebs tv-movies music-radio literature webmasters programming techmarket Links: (1) (2) (3) (4) (5) (6) (7) (8) (9) (10) Nairaland - Copyright © 2005 - 2024 Oluwaseun Osewa. All rights reserved. See How To Advertise. 139 |