News And Technical Analysis From Instaforex - Business (12) - Nairaland
Nairaland Forum / Nairaland / General / Business / News And Technical Analysis From Instaforex (45819 Views)
Get Startup Bonus Of $500 To Trade From Instaforex / News And Technical Analysis From Superforex / News From Instaforex (2) (3) (4)
(1) (2) (3) ... (9) (10) (11) (12) (13) (14) (15) ... (23) (Reply) (Go Down)
| Re: News And Technical Analysis From Instaforex by Instaforexbuk(f): 8:13am On Mar 12, 2018 |
USD/JPY has reached our profit target perfectly, prepare for further rise The price has risen perfectly to our profit target and looks poised to rise further after breaking a strong descending resistance-turned-support line. We look to buy above 106.48 (Fibonacci retracement, horizontal overlap support, breakout level) for a push up to 108.51 (Fibonacci retracement, horizontal pullback resistance). We do have to be cautious about 107.78 resistance as the price might react off that level. RSI (89) has made a similar bullish exit signaling a change in momentum from bearish to bullish. Buy above 106.48. Stop loss at 105.81. Take profit at 108.51. 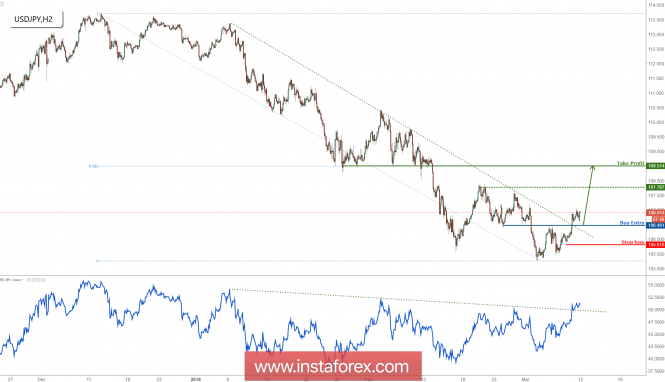 |
| Re: News And Technical Analysis From Instaforex by Instaforexbuk(f): 12:31pm On Mar 19, 2018 |
Fundamental analysis of EUR/USD for March 19, 2018 EUR/USD has been quite impulsive with the bearish pressure breaking below 1.2350 with a daily close. Ahead of the upcoming Fed rate decision which can result in a hike from 1.50% to 1.75%, the impulsive gain on the USD side is quite impressive and explains the current sentiment on the market. EUR has been quite neutral with the economic reports having no strong element to support its gain ahead of the rate hike this week. Today, the Italian Industrial Production report is going to be published which is expected to decrease to -0.5% from the previous value of 1.6%. Besides, the Italian Trade Balance report is expected to decrease to 4.87B from the previous figure of 5.25B and the trade balance report is expected to show a decrease to 22.6B from the previous figure of 23.8B. Moreover, today G20 Meeting is going to be held which is expected to inject good amount of volatility in the market for the whole day. The German Buba Monthly Report is also going to be published which is expected to be quite neutral in nature and will unlikely provide support to EUR. On the other hand, today USD FOMC Member Bostic is going to speak about Interest Rates and Monetary Policies which is expected to help USD gain some momentum ahead of the possible rate hike on Wednesday. As of the current scenario, USD is expected to gain momentum against EUR in the coming days whereas EUR may struggle to keep its grounds leading to impulsive bearish pressure in the pair. Now let us look at the technical view. The price is currently residing below 1.2350 with a daily close and having dynamic level of 20 EMA working as a resistance as well. Ahead of the upcoming rate hike, USD is expected to gain further momentum towards 1.2080 and later towards 1.1720 support area in the coming days. As the price remains below 1.2350 with a daily close, further bearish pressure is expected in this pair. 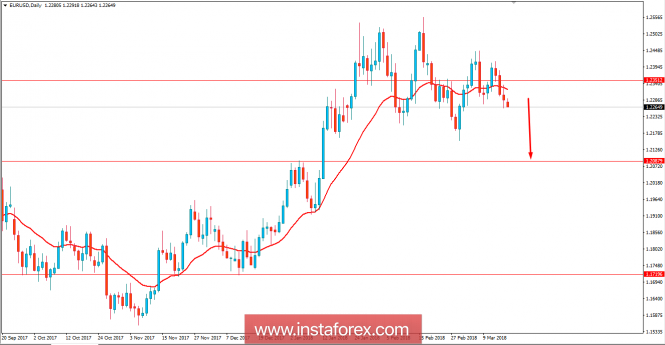 Read more: https://www.instaforex.com/forex_analysis/111761 |
| Re: News And Technical Analysis From Instaforex by Instaforexbuk(f): 5:06pm On Mar 23, 2018 |
Analysis of Gold for March 23, 2018 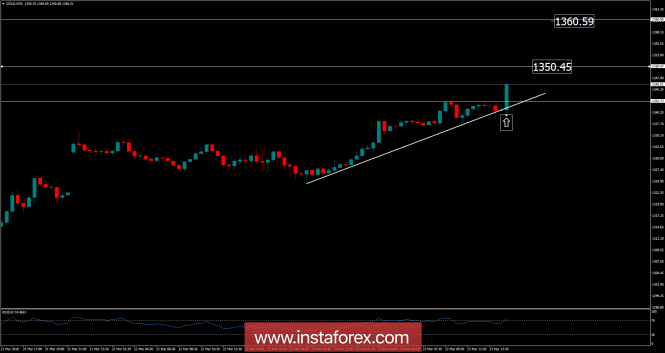 Recently, Gold has been trading upwards. The price tested the level of $1,346.97. According to the 30M time – frame, I found a breakout of yesterday's high in the background, which is a sign that buyers are in control. I also found a successful rejection of the upward trendline, which is another sign of strength. My advice is to watch for potential selling opportunities. The upward targets are set at the price of $1,350.45 and at the price of $1,360.60. Resistance levels: R1: $1,334.27 R2: $1,339.62 R3: $1,344.35 Support levels: S1: $1,324.20 S2: $1,319.46 S3: $1,314.10 Trading recommendations for today: watch for potential buying opportunities. Read more: https://www.instaforex.com/forex_analysis/111937 |
| Re: News And Technical Analysis From Instaforex by Instaforexbuk(f): 7:31am On Mar 26, 2018 |
Daily analysis of EUR/JPY for March 26, 2018 EUR/JPY The conditions in the market is quite choppy. Although the market is choppy, the bearish trend has been maintained.Price has been going southward since February 5, having lost almost 800 pips since then. Last week, there was a rally attempt in the context of an uptrend, which was halted once the supply zone at 131.50 had been tested. Further upward movement was effectively prevented. The market shed 250 pips following that, to test the demand zone at 129.00, and closed below the supply zone at 129.50. The expected weakness in EUR, as well as the bearish outlook on the market, may enable the demand zones at 129.00, 128.50, and 128.00 to be tested this week. Read more: https://www.instaforex.com/forex_analysis/111959
|
| Re: News And Technical Analysis From Instaforex by Instaforexbuk(f): 7:12am On Mar 27, 2018 |
Daily analysis of USDX for March 27, 2018 The index remains under pressure below the 200 SMA at the H1 chart and the support zone of 89.36 is now being pierced, allowing for more losses in the short-term. There are fractals in formation which supports the bearish scenario for the coming days. USDX could be looking to test the 87.88 level and the MACD indicator is favoring to that scenario, as it stays in the negative territory. 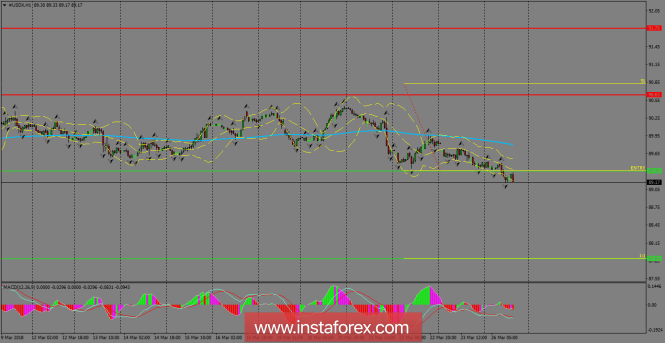 H1 chart's resistance levels: 90.63 / 91.75 H1 chart's support levels: 89.36 / 87.88 Trading recommendations for today: Based on the H1 chart, place sell (short) orders only if the USD Index breaks with a bearish candlestick; the support level is at 89.36, take profit is at 87.88 and stop loss is at 90.81. Read more: https://www.instaforex.com/forex_analysis/112009 |
| Re: News And Technical Analysis From Instaforex by Instaforexbuk(f): 8:46am On Mar 28, 2018 |
BITCOIN Analysis for March 28, 2018 Bitcoin has been quite indecisive recently having a daily candle close with a bullish gain below $8,500 price area. There have been no high impact fundamentals on Bitcoin recently. As a result, the price is now going through a corrective phase with indecision. The Bitcoin market is currently marked with low liquidity and expected to correct itself for a while before it pushes much lower in the coming days. There are watchdogs which are still trying to regulate the Bitcoin and some countries are banning the Bitcoin exchanges and trading. However, the sustainability of Bitcoin provides an indication of its strength against all the odds in the market currently. As for the current scenario, the price is expected to retest $8,500 price area before it progresses much lower towards $7,500 and later towards $5,500 in the short term. The impulsive bearish pressure can be only observed after $7,500 price area is taken out with a daily close in the coming days. Otherwise, the market is expected to consolidate between $7,500 to $8,500 area. 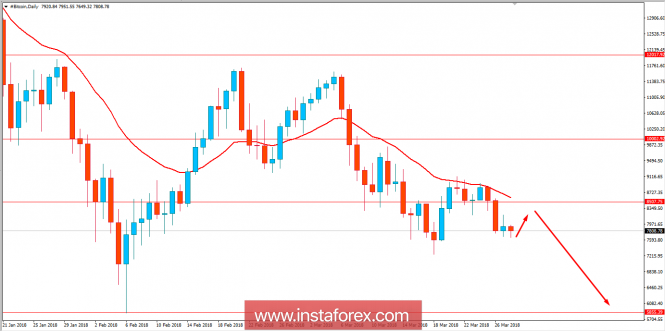 Read more: https://www.instaforex.com/forex_analysis/112093 |
| Re: News And Technical Analysis From Instaforex by Instaforexbuk(f): 9:12am On Apr 03, 2018 |
Bitcoin analysis for 03/04/2018 During the meeting with the legislative arm of Taiwan, the head of the Central Bank, Yang Chin-long, was asked about how the banking authorities will respond to the current lack of transparency in the trade of cryptocurrencies in this country. The discussion was intensified mainly by recent price drops, in accordance with the news given by the Central Taiwan Agency. Answering the parliamentary MP's questions, the Governor of Taiwan said that the Central Bank has increased its efforts to monitor volatile movements of Bitcoin prices and will issue warnings to investors about the risk of cryptocurrency transactions. In addition, Yang said the banking body suggested to the Taiwanese Ministry of Justice that cryptocurrency transactions should be regulated in accordance with the applicable anti-money laundering (AML) regulations in the financial sector.The case remains open and it is not known whether the suggestion will be supported by the ministry, but it is to be the last move of the Taiwanese authorities in implementing BTC regulations. Earlier this month, the finance minister of the island, Sheu Yu-jer, expressed the belief that cryptocurrencies - which are treated like virtual goods - should be taxed in Taiwan. He added that the agency is currently investigating how to implement the appropriate taxation rules. Jang's comments appeared just after other Asian governments, such as South Korea and Malaysia, have already taken action to regulate cryptocurrencies under the anti-money laundering rules to prevent financial crimes. Let's now take a look at the Bitcoin technical picture at the H4 time frame. The market has bounced from the level of $6,400 and now is testing the technical resistance at the level of $7,245, just above the weekly pivot at the level of $7,146. the bounce from the level of $6,400 seems solid, so if the level of $7,245 is broken, then the bulls might push the price higher towards the level of $8,000. Bullish divergence supports the upward view. 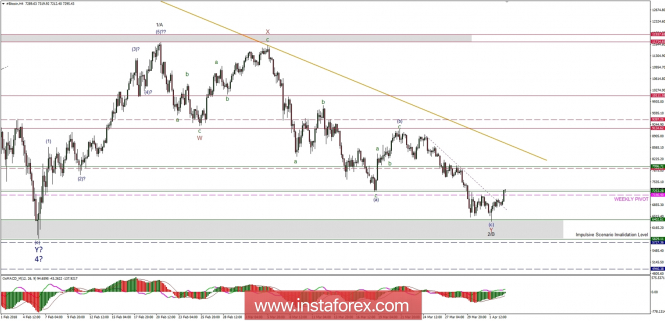 Read more: https://www.instaforex.com/forex_analysis/112379 |
| Re: News And Technical Analysis From Instaforex by Instaforexbuk(f): 7:58am On Apr 04, 2018 |
[B]AUD/USD Approaching Resistance, Lookout For a Reversal [/B] The price is approaching its major resistance at 0.7712 (61.8% Fibonacci extension, 100% Fibonacci extension, 100% Fibonacci extension, 50% Fibonacci retracement, 61.8% Fibonacci retracement, horizontal overlap resistance) where we expect a reversal, pushing price down to its support at 0.7642 (61.8% Fibonacci extension, horizontal swing low support). Stochastic (89, 5, 3) sees resistance at 96% where we expect a corresponding reversal. A bearish divergence with price has also been identified which adds to our bearish bias. Sell below 0.7712. Stop loss at 0.7754. Take profit at 0.7642. 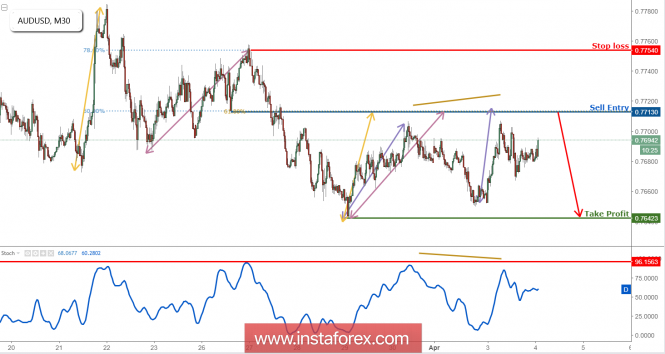 Read more: https://www.instaforex.com/forex_analysis/112437 |
| Re: News And Technical Analysis From Instaforex by Instaforexbuk(f): 9:54am On Apr 05, 2018 |
Bitcoin analysis for 05/04/2018 In the first quarter of 2018, cryptocurrency markets lost just over 48 percent of their value on January 1, and total capitalization dropped from around $ 612 billion to $ 261 billion in the first quarter. The Ripple Price (XRP) - one of the five largest cryptocurrencies listed on CoinMarketCap - fell by almost 78 percent, whose valuation unit is at $ 0.51, compared to January 1, at about $ 2.30. The second largest drop in terms of percentage is Bitcoin Cash (BCH), which lost about 73 percent of its value. In January, its price was around $ 2,543, today it is about $ 697. Litecoin (LTC) fell by about 49 percent from the price of January 1, when it cost about $ 231, where today it is around $ 118. The leading cryptocurrencies, Bitcoin and Ethereum, survived the worst first quarters since their inception. The price of Bitcoin fell by about 52 percent from January 1, when the price was around $ 14,122, to about $ 6,890 on March 31. ETH, which was sold at around $ 755 on January 1. It fell by about 48 percent, to around $ 394 on March 31. The fall in prices in all sectors can be attributed to the increase in regulatory regulation by various global entities, including the Securities and Exchange Commission (SEC), the control of Japanese unregistered cryptocurrency exchanges following the attack on Coincheck and Twitter, Facebook, and Google banning cryptography-related ads. Let's now take a look at the Bitcoin technical picture at the H4 time frame. Despite the initial breakout through the short-term descending trend line, the price was capped at the nearest technical resistance at the level of $7,500 and returned back to the local lows again. Any violation of the technical support at the level of $6,400 will lead to the test of the recent swing low at the level of $5,820. 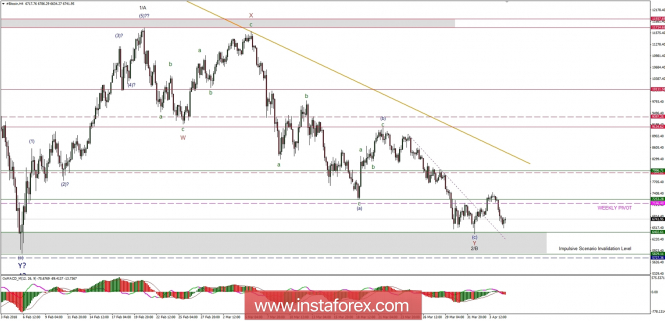 Read more: https://www.instaforex.com/forex_analysis/112587 |
| Re: News And Technical Analysis From Instaforex by Instaforexbuk(f): 3:16pm On Apr 06, 2018 |
Global macro overview for 06/04/2018 On Friday morning, the US Dollar was valued at over 4.05 Turkish Lira. Previously, the USD/TRY exchange rate reached its historic maximum at 4.0657. Over the past 12 months, the Turkish currency has weakened against the dollar by 8.5 percent, and for three years lost as much as 36% of its value. Looking at the long-term chart, one can come to the conclusion that the Turkish currency is actually on a permanent downward trend. But it intensified after the unsuccessful military coup of July 2016. The attempted coup proved unsuccessful, and as a result, President Recep Tayyip Erdogan carried out purges in the state apparatus, education, and media, including practically the Sultan rule in Turkey. At the same time, the Turkish economy is facing serious structural problems. Although the GDP growth rate is 7.3% (in Q4) and it may be impressive, the country is struggling with serious macroeconomic imbalances. The first symptom is the rapidly growing current account deficit, which in January deepened to USD 7.1 billion against USD 2.7 billion a year earlier. This means that Turkish enterprises and households are getting heavily indebted abroad. Secondly, investors are worried by the price rally, which in March amounted to 10.23% towards 10.26%. in February. CPI inflation at double-digit level has been in Turkey for over a year. And there are not very clear views about anything that could be improved in the near future. The Turkish central bank remains under strong political pressure not to raise interest rates. Let's now take a look at the USD/TRY technical picture at the daily time frame. The market is still in the uptrend the recent high was made at the level of 4.0600. This might not be the end of the advance, as there is a Fibonacci extension target level located at 4.0850. The momentum remains strong, but first clues of a potential bearish divergence between the price and the momentum indicator are present. 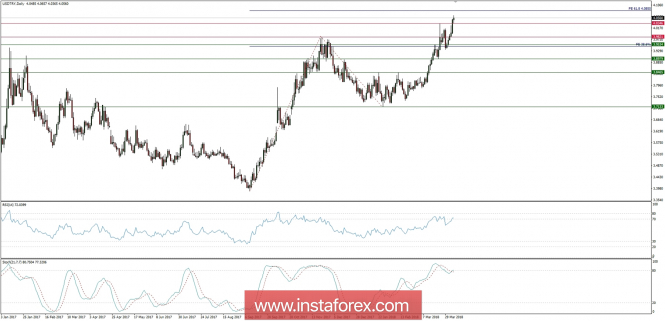 Read more: https://www.instaforex.com/forex_analysis/112739 |
| Re: News And Technical Analysis From Instaforex by Instaforexbuk(f): 8:00am On Apr 09, 2018 |
Bitcoin analysis for 09/04/2018 The Reserve Bank of India (RBI) announced in a statement on the development and regulatory policies, that it was considering issuing its own central bank digital currency (CBDC). RBI set up an inter-ministerial group to explore the potential benefits and feasibility of the CBDC, which will present its findings in the report in June 2018, the statement."Technological innovations, including virtual currencies, have the potential to improve the efficiency and integrity of the financial system." - said Bibhu Prasad Kanungo, deputy RBI governor. The information appeared despite the bank's earlier announcement that it prohibits all regulated entities from providing services to users, traders or holders of cryptocurrencies. The RBI position - a pro-state cryptocurrency and a decentralized cryptocurrency - represents a broader trend among international central banks. One of the solutions to potential problems of central banks, such as money laundering, is the co-optation of Blockchain technology by the institutions themselves, as Kanungo emphasized: "We are aware that Blockchain technology has potential benefits for the financial sector and we believe that it should be encouraged to use it for the benefit of the economy." Already in 2016, the Bank of England and the People's Bank of China analyzed the possibility of issuing their own digital currencies, together with over 90 central banks testing DLT technology in the same year. In 2017, the Bank of Canada published extensive research on the benefits of CBDC, and already in the first months of 2018, banks in Malaysia, Taiwan, Poland, and Switzerland, they conducted research on the use of Blockchain systems. Let's now take a look at the Bitcoin technical picture at the H4 time frame. The market is hovering around the weekly pivot at the level of $6,908 after the spike down towards the technical support at the level of $6,402 was unsuccessful. The nearest technical resistance is still seen at the level of $7,442, just above the weekly pivot resistance at the level of $7,333. The whole impulsive rally will get invalidated when the price will break through the level of $5,829. 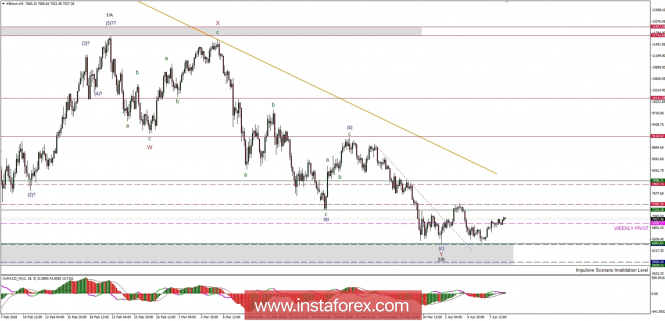 Read more: https://www.instaforex.com/forex_analysis/112763 |
| Re: News And Technical Analysis From Instaforex by Instaforexbuk(f): 8:03am On Apr 10, 2018 |
Wave analysis of the EUR/USD currency pair. Weekly review  Analysis of wave counting: Trades of the past week the EUR/USD pair began with a slowly developing downward movement and, having lost in price more than 100 percentage point, reached the level of 1.2215 on Friday. The resulting wave situation makes it possible to assume that the currency pair has confirmed the transition to the stage of formation of the future wave c, in a, in B, in (C). If this is the case, then the currency pair has good prospects for lowering quotations to the level of the 21st figure, although on a more complex inclined direction. Targets for an upward wave option: 1.2400 Targets for a downward wave option: 1.2032 - 23.6% by Fibonacci 1.1709 - 38.2% by Fibonacci General conclusions and trading recommendations: The trading instrument supposedly completed the construction of the upward trend section. The wave b, in a, in B, in (C) is also supposedly completed. If this is true, and this wave does not take a more complicated form, then the quotes decrease will continue with the targets located near the estimated marks of 1.2032 and 1.1709, which corresponds to 23.6% and 38.2%. Read more: https://www.instaforex.com/forex_analysis/203026 |
| Re: News And Technical Analysis From Instaforex by Instaforexbuk(f): 8:08am On Apr 11, 2018 |
EUR/AUD Approaching Support, Prepare For A Bounce EUR/AUD is approaching its support area at 1.5879 (61.8% Fibonacci extension, 100% Fibonacci extension, horizontal swing low support) where we expect to see a bounce, pushing the price up all the way to its resistance at 1.5976 (50% Fibonacci retracement, horizontal overlap resistance). Stochastic (55, 5, 3) is approaching its support at 5.49% where we expect to see a corresponding bounce. A bullish divergence in price has also been identified which contributes to our bullish bias. Buy above 1.5879. Stop loss at 1.5839. Take profit at 1.5976. 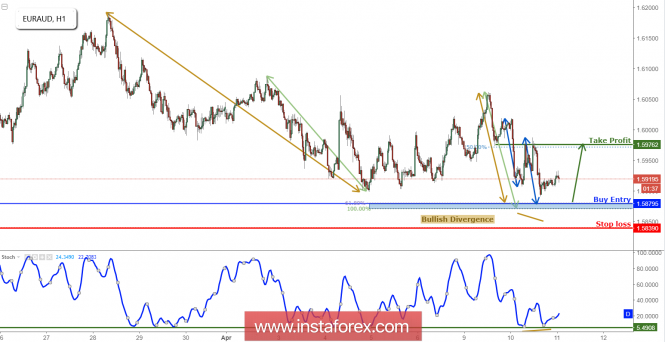 Read more: https://www.instaforex.com/forex_analysis/112986 |
| Re: News And Technical Analysis From Instaforex by Instaforexbuk(f): 10:27am On Apr 12, 2018 |
Technical analysis of USD/JPY for April 12, 2018 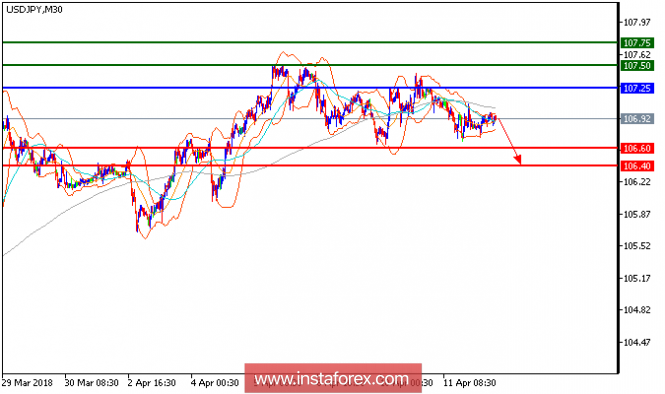 USD/JPY is under pressure and expected to trade with bearish outlook. The pair retreated from 107.05 (the previous high) and broke below its 20-period moving average after touching the 50-period moving average. The relative strength index is below its neutrality level at 50 and lacks upward momentum. Hence, as long as 107.25 is not surpassed, look for a return to 106.60 (lows of April 9 and 10). A break below of this level would trigger another decline to 106.40. Chart Explanation: The black line shows the pivot point. The present price above the pivot point indicates a bullish position, and the price below the pivot point indicates a short position. The red lines show the support levels, and the green line indicates the resistance levels. These levels can be used to enter and exit trades. Strategy: SELL, stop loss at 107.25, take profit at 106.60 Resistance levels: 107.50, 107.75, and 108.00. Support levels: 106.60, 106.40, and 106.00. Read more: https://www.instaforex.com/forex_analysis/113141 |
| Re: News And Technical Analysis From Instaforex by Instaforexbuk(f): 7:29am On Apr 13, 2018 |
Elliott wave analysis of EUR/JPY for April 13, 2018 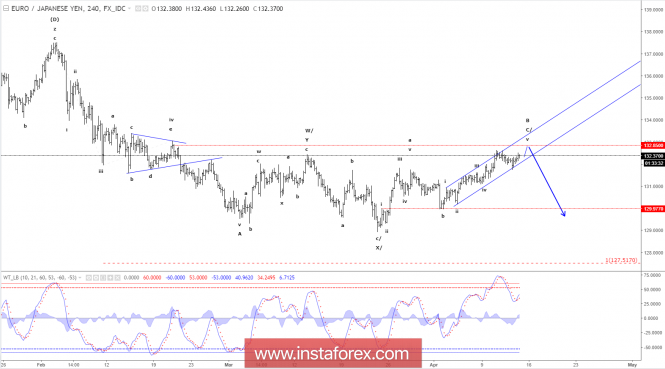 A final spike closer to 132.82 remains expected before renewed downside pressure is expected. Short-term, we will remain cautiously bullish for the spike to 132.82 as long as minor support at 131.75 is able to protect the downside, but from 132.82 or upon a break below minor support at 131.75 a new impulsive decline towards 128.93 and lower is expected. R3: 133.39 R2: 132.82 R1: 132.62 Pivot: 132.05 S1: 131.75 S2: 131.65 S3: 131.65 Trading recommendation: We are long EUR from 130.70. We will raise our stop+reverse to 131.70. Our take profit+reverse remains at 132.65 Read more: https://www.instaforex.com/forex_analysis/113213 |
| Re: News And Technical Analysis From Instaforex by Instaforexbuk(f): 10:40am On Apr 16, 2018 |
Technical analysis of GBP/USD for April 16, 2018 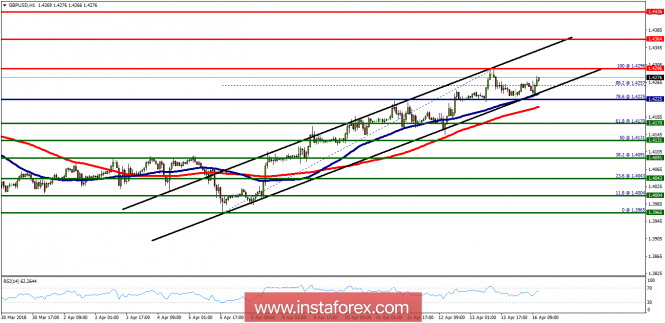 Overview: The GBP/USD pair continues to trade upwards from the level of 1.4225 (the daily pivot point). Last week, the pair rose from the level of 1.4170 (the level of 1.4170 is coincided with the major support today) to the top around 1.4296. Today, the first resistance level is seen at 1.4364 followed by 1.4426, while daily support 1 is seen at 1.4170. According to the previous events, the GBP/USD pair is still moving between the levels of 1.4225 and 1.4364; for that we expect a range of 139 pips (1.4364 - 1.4225) at least in coming days. If the GBP/USD pair fails to break through the resistance level of 1.4364, the market will decline further to 1.4170. This would suggest a bearish market because the RSI indicator is still in a positive area and does not show any trend-reversal signs. The pair is expected to drop lower towards 1.4170 with a view to test the daily support. On the contrary, if a breakout takes place at the resistance level of 1.4364, then the trend will continue to move towards the next target of 1.4426. Read more: https://www.instaforex.com/forex_analysis/113367 |
| Re: News And Technical Analysis From Instaforex by Instaforexbuk(f): 7:43am On Apr 17, 2018 |
Fundamental Analysis of EUR/USD for April 17, 2018 EUR/USD has been quite impulsive with the bullish gains recently which engulfed the recent bearish pressure with a daily candle yesterday. The volatility in the EURUSD is still quite high and expected to have no definite trend momentum until 1.25 is broken above or 1.21 is broken below. Despite having worse economic reports EUR gained good momentum over USD recently which is expected to push higher in the coming days. Today EUR German ZEW Economic Sentiment report is going to be published which is expected to decrease to -0.8 from the previous positive figure of 5.1, Italian Trade Balance report is expected to show an increase to 2.23B which previously was at -0.09B and ZEW Economic Sentiment report is expected to decrease to 7.3 from the previous figure of 13.4. On the other hand, today USD Building Permits report is going to be published which is expected to increase to 1.33M from the previous figure of 1.30M, Housing Starts is also expected to increase to 1.27M from the previous figure of 1.24M, Capacity Utilization Rate is expected to have slight decrease to 77.9% from the previous value of 78.1% and Industrial Production report is expected to decrease to 0.3% from the previous value of 1.1%. Moreover, today FOMC Member Williams and Quarles is going to speak about the nation's interest rate and monetary policy which is expected to be neutral in nature. As of the current scenario, both currencies in the pair is expected to have mixed economic results today and this week there is no further high impact economic reports or events to push the price into a definite trend but as the EUR is quite stronger in comparison to USD with the market sentiment, further bullish momentum is expected after certain retracement along the way in the coming days. Now let us look at the technical view. The price is currently residing above 1.2350 which was recently broken below with a daily close showing good evidence of price proceeding lower. As of yesterday, after having a daily close above 1.2350 does signify previous bearish move as a false break which is currently expected to push the price much higher in the coming days with the target towards 1.2450-1.25 price area. As the price remains above 1.2350 area, the further bullish pressure is expected in this pair. 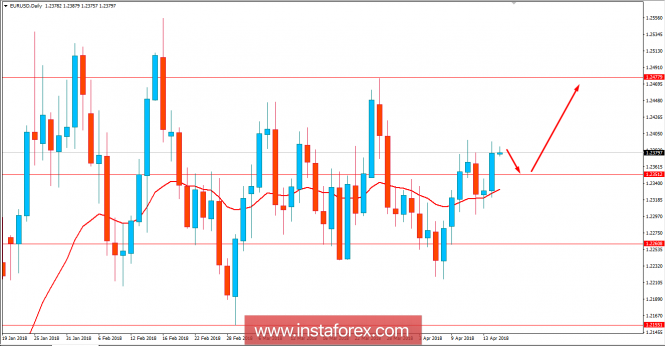 Read more: https://www.instaforex.com/forex_analysis/113457 |
| Re: News And Technical Analysis From Instaforex by Instaforexbuk(f): 9:38am On Apr 18, 2018 |
Euro buyers need to be very careful Yesterday, a number of good fundamental data on the US economy had a good support for the US dollar and statements by representatives of the Fed, which are scheduled for this week, gave even more optimism to investors. For example, a representative of the Fed, Evans, said yesterday that the regulator could continue to gradually increase interest rates, even though there is no risk of excessive acceleration of inflation. Charles Evans also voiced anxiety about the uncertainty regarding foreign trade policies, which could carry risks to the US economy. His colleague in charge, the president of the Federal Reserve Bank of San Francisco, John Williams, also remains optimistic about the rates and growth pace of the US economy. However, Williams sees the risks for the growth of the US economy in the next few years, which are mainly tied to the foreign trade policy of the White House. First of all, according to the president of the FRS San Francisco, under the negative impact of the current policy of Trump, there will be companies and ordinary consumers. According to Williams, he expects that the GDP growth rate this year will average 2.5%. Fed President Philadelphia Harker did not comment on the situation associated with the prospects for monetary policy, saying only that unemployment is now below the natural level, which is a good signal for the Federal Reserve System. For today, there is a planned release of a number of important fundamental statistics for the euro area, including inflation, which may determine the further direction in the EURUSD pair at the end of the week. As for the technical prospects, while the trade is above the lower border of the rising channel, which is currently taking place in the area of 1.2340, there is no special reason to worry about the further growth of the euro. However, its breakthrough will lead to the demolition of a number of stop orders of large buyers, which will quickly pull the euro down to levels of 1.2300 and 1.2270. In case of further growth, problems for bulls can occur at the levels of 1.2380 and 1.2420. The Japanese yen ignored good data on Japan's export growth and continued its decline against the US dollar. According to the report of the Ministry of Finance, Japan's exports in March 2018 grew as a result of good foreign demand, mainly for cars and equipment. Thus, exports increased by 2.1% compared to the same period of the previous year, while economists forecast a larger increase of 4.9%. Japan's foreign trade surplus in March amounted to 797.3 billion yen against 440 billion yen from economists predicted.  Read more: https://www.instaforex.com/forex_analysis/203756 |
| Re: News And Technical Analysis From Instaforex by Instaforexbuk(f): 7:39am On Apr 19, 2018 |
Elliott wave analysis of EUR/NZD for April, 19 2018 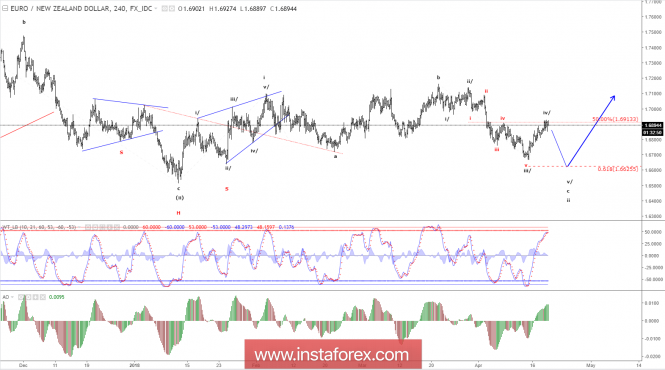 Wave iv/ is pushing the limit. A rally above the low of wave i/ at 1.6981 can not be allowed, or the preferred count will be invalidated. We do expect important resistance at 1.6981 to remain untouched and will be looking for a break below short-term support at 1.6861 soon, to confirm a top being in place for renewed downside pressure towards the 1.6625 target. R3: 1.6981 R2: 1.6957 R1: 1.6925 Pivot: 1.6861 S1: 1.6844 S2: 1.6815 S3: 1.6755 Trading recommendation: Our stop at 1.6915 was hit for a 70 pips loss. We will sell EUR at 1.6920 or upon a break below 1.6861. Our stop will be placed at 1.6985. Read more: https://www.instaforex.com/forex_analysis/113704 |
| Re: News And Technical Analysis From Instaforex by horlajumokhe(f): 5:04pm On Apr 19, 2018 |
Instaforexbuk: Hello sir please how can I retrieve my phone password |
| Re: News And Technical Analysis From Instaforex by Instaforexbuk(f): 8:32am On Apr 20, 2018 |
[B]The sterling has every chance to continue its decline [/B] The British pound again fell in the wake of a sell-off due to the release of weak data on retail sales and volume in the UK. According to the data presented, the base retail sales index in March fell by 0.5% against the forecast of a decline by 0.4% and the February growth by 0.4%. In annual terms, the indicator in growth fell to 1.1% against expectations of growth of 1.4% and the previous value of 1.2%. The retail sales in annual terms fell to 1.1% against the forecast of growth of 2.0% and the previous value of 1.5%, and its March value fell more than expected, by 1.2%, against 0.5% and February growth by 1.5%. First, after the publication of the data, sterling, oddly enough, even received support and began to gain against the US dollar. Such dynamics of the market can be explained by the general weakness of the US dollar and the likely desire of a number of large market players to take advantage of the low activity of market participants and "collect orders" for those whose bet on the selling of the GBPUSD pair. But everything already fell into place in the Asian trading session, the pair fell more than one figure and "lies" at the support level of the short-term uptrend. Assessing the prospects for the Bank of England, we note that it faces a difficult task, which, it seems, will force itself to refrain from deciding to raise interest rates at the June meeting. The reason for this is the latest data of economic statistics, which indicated not only a drop in inflationary pressures, but also a general decline in economic growth, as the latest GDP data show. Another strong negative for the British pound is the unresolved issue of Britain's withdrawal from the EU. After the active negotiation process in the winter of this year, in the spring everything was quiet. The British agreed on a transition period, but it seems that they have failed to reduce the financial compensation of the EU, which has a negative impact on the country's economy, of course, apart from the very factor of the severance of many economic ties between Britain and continental Europe. It is likely that we will witness a new wave of a decline in sterling. Forecast of the day: The GBPUSD is trading above 1.4065 on a wave of expectations that the Bank of England will continue the cycle of raising interest rates in the near future. Estimating this, we can assume that the pair after overcoming the mark of 1.4065 will then fall to 1.3960. The USDCAD pair continues to grow towards our target level of 1.270 amid the Canadian CBA's lack of desire to raise rates. The pair also supports and stops the rise in oil prices after reaching a local peak. Most likely, if the pair overcomes the level of 1.2700, its growth will continue to 1.2800, if the price of oil again unfolds upwards. 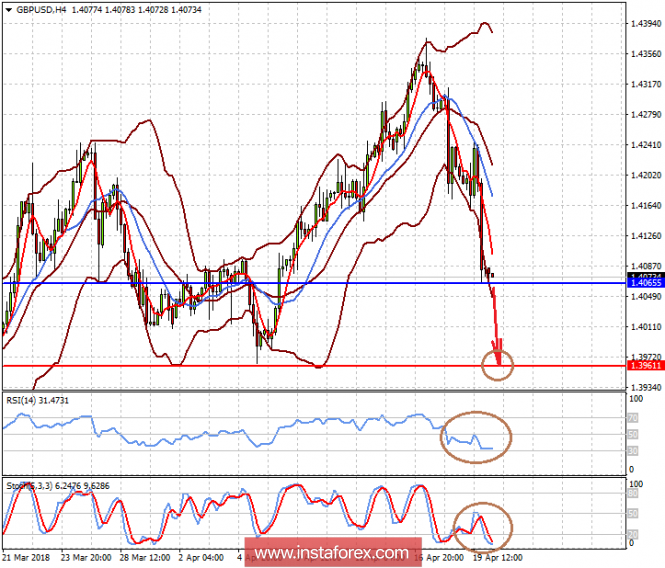 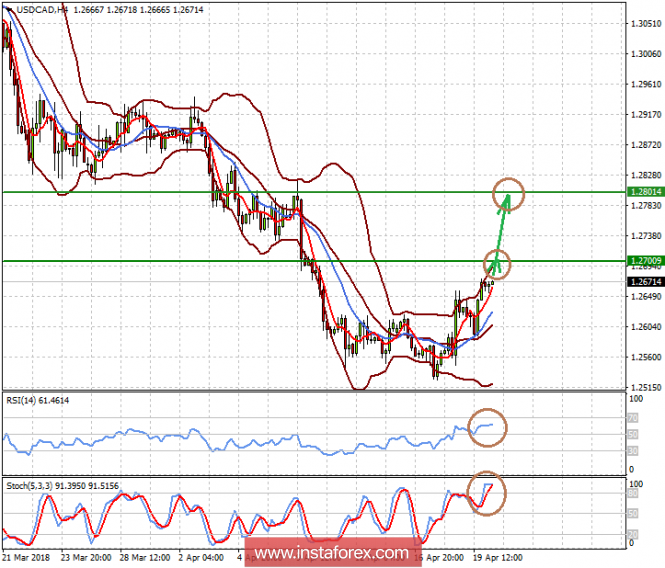 Read more: https://www.instaforex.com/forex_analysis/203918 |
| Re: News And Technical Analysis From Instaforex by Instaforexbuk(f): 9:27am On Apr 23, 2018 |
Daily analysis of USDX for April 23, 2018 The index has been consolidating above the 200 SMA following a breakout of the tight range in which has been trapped. The next target to the upside still lies at 90.36, where a corrective move could take place in order to gather enough momentum to break higher. If that happens, then it could be on the way to reach the 91.75 level. 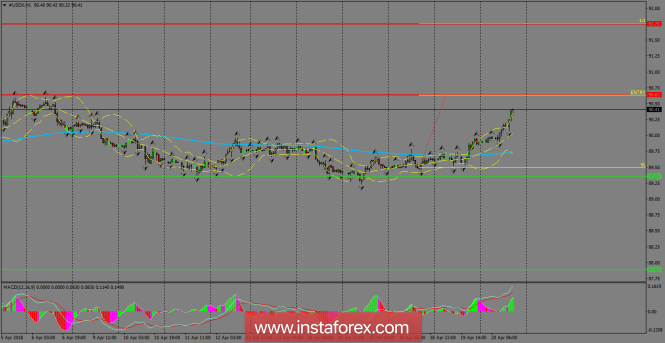 H1 chart's resistance levels: 90.63 / 91.75 H1 chart's support levels: 89.36 / 87.88 Trading recommendations for today: Based on the H1 chart, place buy (long) orders only if the USD Index breaks with a bearish candlestick; the support level is at 90.63, take profit is at 91.75 and stop loss is at 89.49. Read more: https://www.instaforex.com/forex_analysis/113932 |
| Re: News And Technical Analysis From Instaforex by Instaforexbuk(f): 8:51am On Apr 24, 2018 |
GBP/JPY Bounced Nicely Off Its Support, Lookout For a Further Rise GBP/JPY tested its support at 150.58 (61.8% Fibonacci retracement, 38.2% Fibonacci retracement, horizontal overlap support, ascending support line) where we expect it to rise further to its resistance at 153.85 (100% Fibonacci extension, 61.8% Fibonacci extension, 76.4% Fibonacci retracement, horizontal swing high resistance). We do have to be cautious of the intermediate resistance at 152.19 (50% Fibonacci retracement, horizontal overlap resistance). Stochastic (89, 5, 3) bounced off its support at 2.03% where it has a lot of upside potential. Buy above 150.58. Stop loss 149.69. Take profit at 153.85. 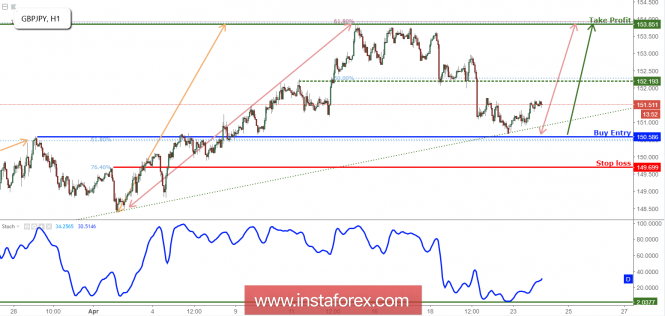 Read more: https://www.instaforex.com/forex_analysis/114059 |
| Re: News And Technical Analysis From Instaforex by Instaforexbuk(f): 8:52am On Apr 25, 2018 |
GBP/USD Bounced Nicely Off Its Support, Potential Breakout GBP/USD bounced nicely off its support at 1.3930 (100% Fibonacci extension) where we expect it to rise further if it breaks out of its immediate resistance at 1.3992 (horizontal overlap resistance, descending channel). Once this level is broke, a bullish acceleration would be triggered, causing price to rise to its resistance at 1.4176 (61.8% Fibonacci extension, 61.8% Fibonacci retracement, horizontal overlap resistance). We do need to be cautious of the intermediate resistance at 1.4090 (38.2% Fibonacci retracement, horizontal overlap resistance). Stochastic (89, 5, 3) shows a corresponding bounce off its support at 2.6%. Buy above 1.3930. Stop loss at 1.3848. Take profit at 1.4176. 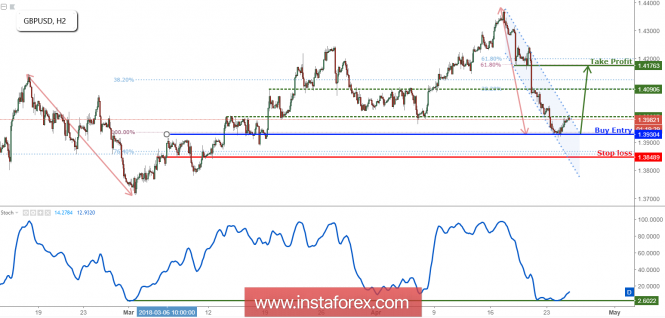 Read more: https://www.instaforex.com/forex_analysis/114175 |
| Re: News And Technical Analysis From Instaforex by markbenny(m): 5:41pm On Apr 25, 2018 |
I hope you do realize how wrong and misleading this information is. I was here very early this morning because I had an open position (sell), I was afraid of the rebound so I read your analysis but didn't believe it GBPUSD went as low as 1.39300 and you are a broker, later when people complain of issues, you will use grammar to close the matter, please don't post signals you are not sure of Instaforexbuk: |
| Re: News And Technical Analysis From Instaforex by Instaforexbuk(f): 8:01am On Apr 26, 2018 |
Daily analysis of USD/JPY for April 26, 2018 USD/JPY This pair has gained about 180 pips this week, and the price is now close to the supply level at 109.50. The supply level would be breached to the upside as price targets other supply levels at 110.00 and 110.50. There could be bearish efforts along the way, but things would be overpowered by the ongoing bullish momentum. 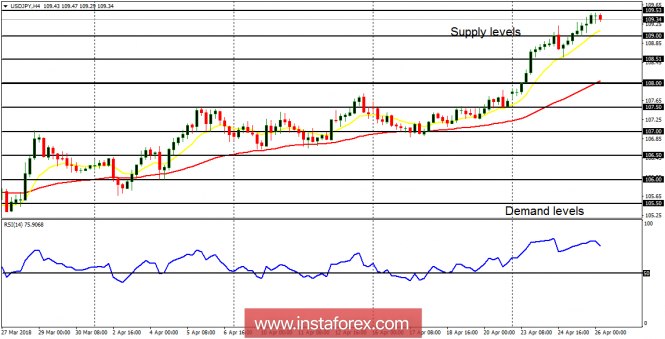 There a Bullish Confirmation Pattern in the market, which is brought about by the recent rally. The EMA 11 is above the EMA 56, and the RSI period 14 is above the level 50. Some fundamental figures are expected today and they may have an impact on the market. *The market analysis posted here is meant to increase your awareness, but not to give instructions to make a trade. Read more: https://www.instaforex.com/forex_analysis/114320 |
| Re: News And Technical Analysis From Instaforex by Instaforexbuk(f): 10:27am On Apr 27, 2018 |
Trading plan for gold for April 27, 2018 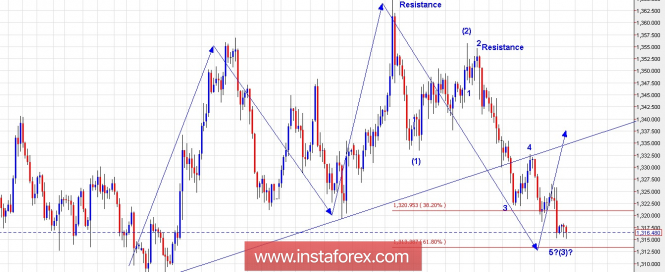 Technical outlook: Gold 4H chart has been presented here for a larger swing picture. After consolidating for past several weeks, the yellow metal finally peaked at $1,365.00 on April 11, 2018. Since then the story is of lower lows and lower highs and it is still expected to continue the same. Looking at the short term structure, the metal is expected to find the interim support around $1,310 levels. Besides, the the fibonacci extension of 61.8% is also seen to be around $1,313 levels, and hence bullish reversal is expected soon. Please note that this should not be considered as a trend reversal but just a corrective rally is expected for now. Looking at the wave counts, the yellow metal seems to be into its 3rd wave now, which is most likely to end soon. Conservative traders should be looking to book profits in the short term and look for opportunities higher to sell again. Trading plan: Aggressive traders look to go long with stop below $1,305 levels. Conservative traders please take profits on short positions taken earlier and remain flat. Fundamental outlook: Watch out for German unemployment rate at 03:55 AM EST today. Good luck! *The market analysis posted here is meant to increase your awareness, but not to give instructions to make a trade. Read more: https://www.instaforex.com/forex_analysis/114461 |
| Re: News And Technical Analysis From Instaforex by Instaforexbuk(f): 12:55pm On Apr 30, 2018 |
Trading Plan for AUDUSD for April 30, 2018 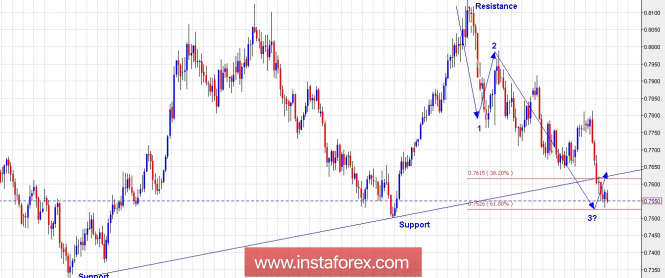 Technical outlook: The daily chart view presented for AUD/USD is suggesting that the current drop that began in January 2018 from 0.8130 levels is nearing a major price support and Fibonacci 61.8% extension near 0.7500 levels as shown here. Please note that while dropping lower for last 4 months, the pair has broken below its 1-year support trend line and is also looking to take out the price support near 0.7500 levels, before pulling back. Traders who are holding short positions, should prepare to book profits for now and remain flat; while aggressive traders should be preparing to turn bullish for a potential counter trend rally. Looking into the wave counts, the current drop has unfolded into 3 waves until now. Hence chances remain for a continued rally as well. It is still unclear whether AUD/USD is wanting to drop into 5 waves or not. It can be only confirmed in the coming sessions where the counter trend rally would end. Trading plan: Prepare to take profits on short positions taken earlier. Aggressive traders prepare to go long around 0.7500 levels with a tight stop. Fundamental outlook: Watch out for German consumer Price Index and US PCE Core at 08:00 AM EST and 08:30 AM EST, respectively. Good luck! Read more: https://www.instaforex.com/forex_analysis/114635 |
| Re: News And Technical Analysis From Instaforex by Instaforexbuk(f): 8:23am On May 02, 2018 |
Bitcoin analysis for 02/05/2018 The latest Gov't report from Hong Kong reports that Bitcoin puts a "medium-low" risk in financial crime, according to Hong Kong Financial Services and Treasury (FSTB). The report was to establish a status on money laundering and terrorist financing. It states explicitly that virtual currencies, such as Bitcoin, are not particularly used in any type of financial crime, although there is an inherent vulnerability to money laundering. The report mentions the use of cryptocurrencies in the pyramids, so-called Ponzi and cybercrime. The report refers in particular to police reports, where in 2013-2017, 167 Bitcoins participated in such non-legal projects. "Although we have not found a significant risk in these modern payment methods, it is a rapidly growing field that requires constant monitoring."- notes the report, pointing out that financial supervision authorities in Hong Kong and law enforcement agencies will work together to look at the risks associated with ICO and generally cryptocurrencies. According to the report, cryptocurrencies are not considered legal tender in Hong Kong. FTSB suggests that because Hong Kong is one of the freest economies in the world with a dynamic currency market and a lack of capital control, VCs are not as attractive as in economies where people may try to avoid currency controls or seek refuge from high inflation rates. Finally, it was also added that BTC ATMs in Hong Kong are not widely used by citizens. Let's now take a look at the Bitcoin technical picture at the H4 time frame. The price has broken below the black trend line at the level of $9,126 and now is heading towards the level of $8,706. The key technical support is still seen at the level of $8,355, but the current price action does not look impulsive actually. It is quite possible that instead of five waves to the upside, the market will perform only three waves up and will continue with the downtrend. 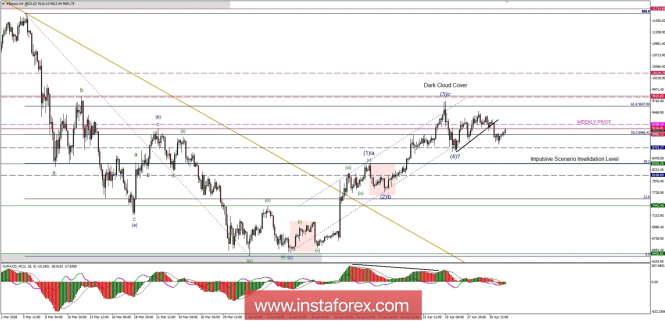 Read more: https://www.instaforex.com/forex_analysis/114767 |
(1) (2) (3) ... (9) (10) (11) (12) (13) (14) (15) ... (23) (Reply)
ICPC Arrests Osun FCMB Manager Over New Naira Notes Policy Violation / Forbes 2015 Billionaires List Released. 5 Nigerians Made The List / Kwik Cash Borrowing
(Go Up)
| Sections: politics (1) business autos (1) jobs (1) career education (1) romance computers phones travel sports fashion health religion celebs tv-movies music-radio literature webmasters programming techmarket Links: (1) (2) (3) (4) (5) (6) (7) (8) (9) (10) Nairaland - Copyright © 2005 - 2024 Oluwaseun Osewa. All rights reserved. See How To Advertise. 145 |