| Re: Chronicle Of A Data Scientist/analyst by yemyke001(m): 11:23pm On Jun 06, 2020 |
Ejiod:
I will answer your questions:
For the 1st question: Still hold on to your Scrapy tool even if you are doing BeautifulSoup
For the 2nd: I can’t be specific though. 4-5years ago there was a spike in Tech jobs especially once you are good with JavaScript. Then NodeJs and Angular were cute. ReactJs came to light but wasn’t fully functional. Web development role was the fastest way to land a job then. I did a lot of individual projects before applying for web role. Even up till today I get some full stack dev role that I never applied which I always decline cos I’m into DATA.
Would I say it’s chance? Maybe or maybe not.
Your CV/Resume matters. Some don’t mention their portfolio on their CV and expect to be called. While my 1st role as developer I still took nights to learn Python and data stuffs with all seriousness. I’m certain once you are done schooling and by then you build your portfolio getting an offer won’t be an issue.
I was versatile. Even to the point I learnt Automated Software testing and my chances of being called was like 70%. See, one thing I advise is when you get to any position.. don’t ever feel comfortable cos success can sometimes be a bitch that makes you not to climb the tallest building.
For Number 3: Yes Excel is powerful and I bet some that call themselves data scientist can’t do simple or complex computation on excel.
So add Excel to your arsenal.
You are generous. There's no way you won't be blessed. You motivated me to this level I am in data science having bagged a first class degree in the same field as yours(Biochemistry). I'm highly spirited now, cos if someone with same background as mine can do this,then I have no excuse. THANK YOU SIR EJIOD. GOD BLESS YOU 8 Likes |
| Re: Chronicle Of A Data Scientist/analyst by Kaycee54321(m): 1:08am On Jun 07, 2020 |
Ejiod:
1. For quick analysis.
2. Referencing. I suggest you add XLOOKUP & XMATCH to your arsenals
3.Communicating with your lower team. You send the excel spreadsheet
4. Your boss may be interested in only the information based on the excel and not python
5. Quick charts.
6. Infact learn Google sheet as well.
7. Financial modeling for those on accounting
8. Conditional formatting
9. Split text column. Try go deep on data validations then you understand.
10. There are so many things you can do on Excel but not with pandas.
A typical person like me daily
1. Tableau
2. SQL
3. Excel
4. Google sheet
5. PowerPoint because you must present at least a month
6. Jupyter notebook
7. Rapid miner
Hope I answered your question. Big man. Is it safe for one to rather use Rapid Miner for predictions rather than learning Sk-learn library in Python? Just like people use Tableau/Power-Bi instead of the Matplotlib Library? Modified: I'm asking anybody who can help with an answer too. 1 Like 1 Share |
| Re: Chronicle Of A Data Scientist/analyst by iCode2: 6:22am On Jun 07, 2020 |
Grandlord:
Lol bro. E no hard like that. Time and effort make the difference. There's a chapter on ATBS specifically focused on web scraping. Maybe you've not read it yet. Lol yea. I dropped ATBS and moved to another book when I was having issues with functions. I'll go back to ATBS when I'm done with the new book. 2 Likes |
| Re: Chronicle Of A Data Scientist/analyst by noob03saibot(m): 7:24am On Jun 07, 2020 |
Zabiboy:
For DAX Expression exercises in Power bi, check wiseowl . co . uk, w3resource . com, kaggle .com.
For exercises without DAX Expression, you can use same sites...
Basically, what can be done in Tableau can be done in power bi...so if you try out any tableau project, you can replicate too in power bi...
If you are on twitter, you can search for #makeovermonday....every sunday, a dataset is dropped and we submit our analysis in Tableau on monday or latest by Wednesday....Its a chance to improve yourself
GL 
Bro! Your head dey there abeg. Please can you drop a site where I can get exercises in csv to download for excel? And please want to ask if you can put me through on how to move excel files into mysql to finish work on them? Please man. Sql is really crazy, loving it so far |
| Re: Chronicle Of A Data Scientist/analyst by Zabiboy: 8:03am On Jun 07, 2020 |
yemyke001:
I love wiseowl.co....as regard the makeover Monday, can't the analysis be submitted with POWERBI?
Nope..you cant..
Bcz it's organized by Tableau Developers...
Interestingly, they are working on a way python codes can be used in tableau as a calculated field... 
But as usual, you can do it as a personal project on Power Bi using their dataset.
GL
|
| Re: Chronicle Of A Data Scientist/analyst by Zabiboy: 8:12am On Jun 07, 2020 |
Kaycee54321:
Big man. Is it safe for one to rather use Rapid Miner for predictions rather than learning Sk-learn library in Python?
Just like people use Tableau/Power-Bi instead of the Matplotlib Library?
Modified: I'm asking anybody who can help with an answer too.
I'll say you should have an idea about both..
Most organisations dont really specify which software or library to use,.The main point is that your presentation should be simple and easy to understand..
We all learn Tableau, PowerBi , excel, matplotlib, seaborn not like we need all for one project but each of them have their own strengths and weaknesses moving forward...
So basically, the point is have an idea of all..whichever suits a project you are working on, you use it..
GL
5 Likes |
| Re: Chronicle Of A Data Scientist/analyst by yemyke001(m): 8:20am On Jun 07, 2020 |
Zabiboy:
Nope..you cant..
Bcz it's organized by Tableau Developers...
Interestingly, they are working on a way python codes can be used in tableau as a calculated field...
But as usual, you can do it as a personal project on Power Bi using their dataset.
GL
Ok.. But I'm finding it difficult to even get a link to the dataset |
| Re: Chronicle Of A Data Scientist/analyst by Zabiboy: 8:21am On Jun 07, 2020 |
noob03saibot:
Bro! Your head dey there abeg. 1) Please can you drop a site where I can get exercises in csv to download for excel? 2) And please want to ask if you can put me through on how to move excel files into mysql to finish work on them? Please man. Sql is really crazy, loving it so far
1) kaggle . com...there are millions of dataset there...or if you are still learning, i advice you check out w3resource . com, bcz they drop solution to the exercises in case you are stuck somewhere..
2) We all love MySql bro....but only after you'v mastered it...I dont think you can move excel file into MySql...i tried that when i was learning back then but it didn't work...What you can do is to duplicate the excel file and change the extension to .sql and try importing the file....If it doesnt work, i suggest yoi google it.....This is one of the major advantage Pandas have over MySql..
GL
4 Likes 1 Share |
| Re: Chronicle Of A Data Scientist/analyst by Zabiboy: 8:26am On Jun 07, 2020 |
yemyke001:
Ok.. But I'm finding it difficult to even get a link to the dataset
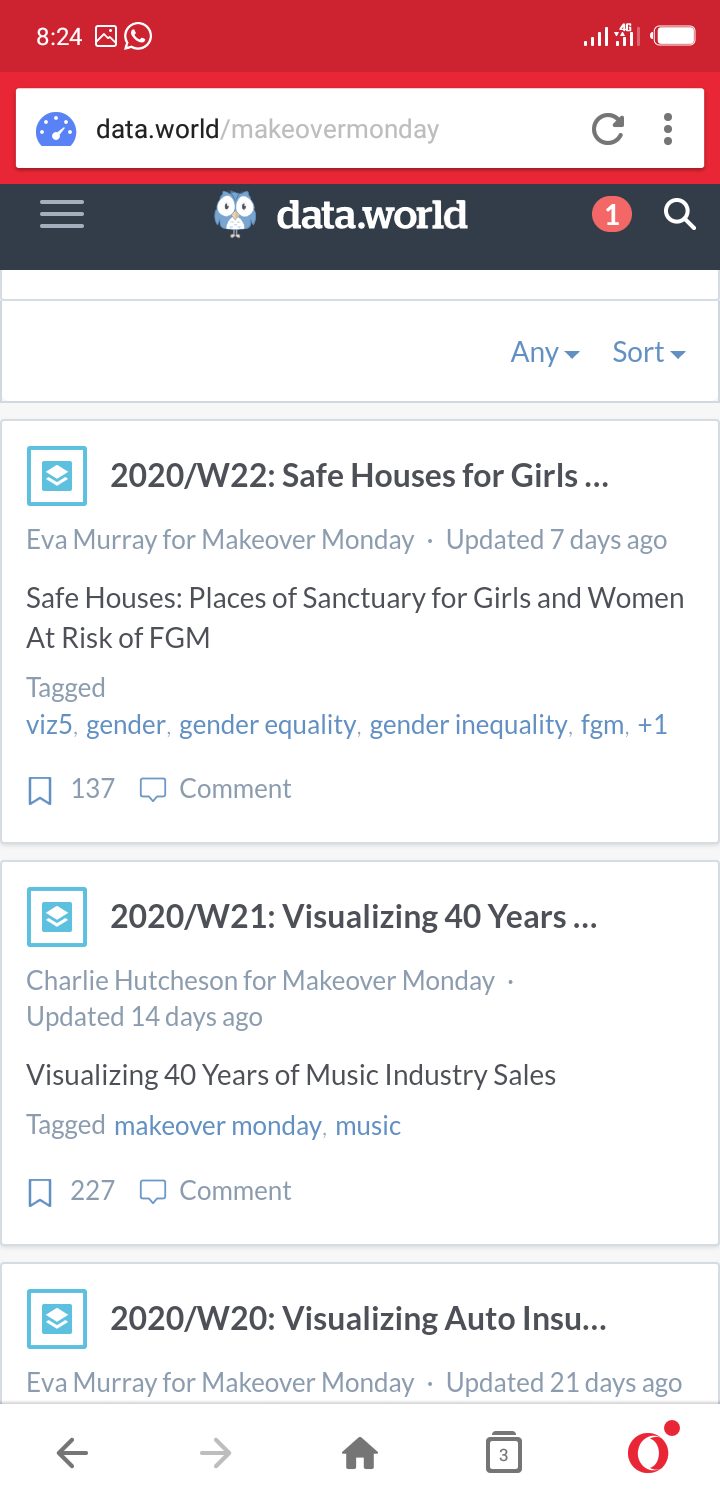
Goto for data.world ( its a website)
Open an account
Search for @makeovermonday
This is 2020 week 23...this week's own would be posted later today but you can see previous weeks....
See the pic below
GL
3 Likes 1 Share 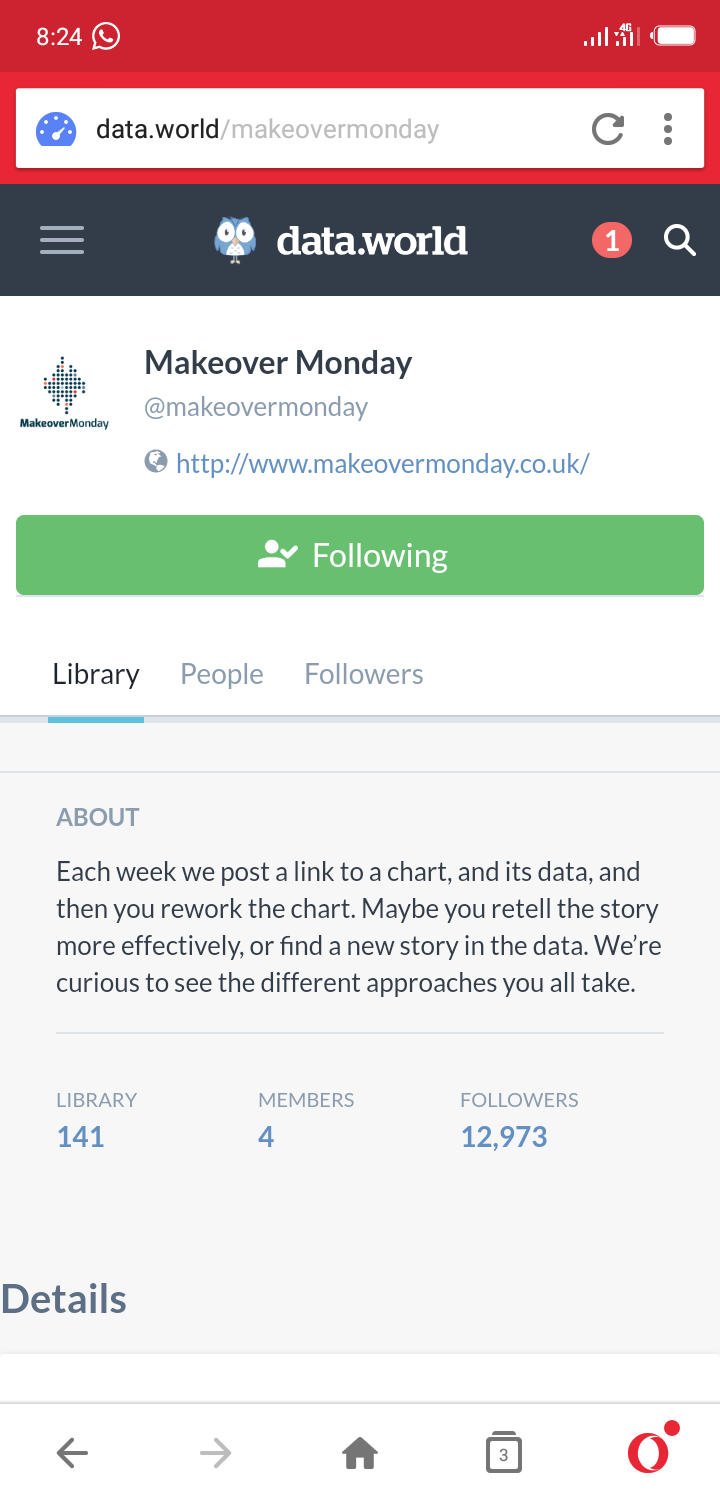
|
| Re: Chronicle Of A Data Scientist/analyst by Ejiod(m): 8:39am On Jun 07, 2020 |
Zabiboy:
I'll say you should have an idea about both..
Most organisations dont really specify which software or library to use,.The main point is that your presentation should be simple and easy to understand..
We all learn Tableau, PowerBi , excel, matplotlib, seaborn not like we need all for one project but each of them have their own strengths and weaknesses moving forward...
In matplotlib, you can annotate( use pointers) which is not in Tableau/powerbi...but in tableau, you can get future forcast etc
So basically, the point is have an idea of all..whichever suits a project you are working on, you use it..
GL
Seems you are yet to understand the power of Tableau and PowerBI. Tableau being the king of Data visualization was and is so powerful that SalesForce acquired it for $15.7Billion. Only place matplotlib comes ahead is animation chart of which Tableau just released this year and they are already building ontop of it. Even Excel can annotate not talk of Tableau or PowerBI or Google Data studio or Qlik 10 Likes 1 Share |
| Re: Chronicle Of A Data Scientist/analyst by Ejiod(m): 8:43am On Jun 07, 2020 |
Kaycee54321:
Big man. Is it safe for one to rather use Rapid Miner for predictions rather than learning Sk-learn library in Python?
Just like people use Tableau/Power-Bi instead of the Matplotlib Library?
Modified: I'm asking anybody who can help with an answer too. Please learn and implement with python so you get the underlying principles behind ML. Once you are firm just do RapidMiner or Even Orange3. 5 Likes |
| Re: Chronicle Of A Data Scientist/analyst by muzzling17(f): 8:45am On Jun 07, 2020 |
mcemmy0z:
If you reside around songo Ota I have these available
*Udemy - Beginner to Pro in Excel Financial Modeling and Valuation
*Udemy - SQL - MySQL for Data Analytics and Business Intelligence
*Tableau 10 A-Z Hands-On Tableau Training For Data Science!
*Tableau Hands-on Learn Data Visualization with Tableau
*Udemy - Power BI A-Z Hands-On Power BI Training For Data Science
*Udemy - Machine Learning A-Z™ Hands-On Python & R In Data Science
*Udemy - Python for Financial Analysis and Algorithmic Trading Good day sir, pls I reside around Akute, but I can come to sango Ota to collect it. Thank you sir. |
| Re: Chronicle Of A Data Scientist/analyst by Nobody: 8:58am On Jun 07, 2020 |
|
| Re: Chronicle Of A Data Scientist/analyst by eldolink: 9:03am On Jun 07, 2020 |
mcemmy0z:
If you reside around songo Ota I have these available
*Udemy - Beginner to Pro in Excel Financial Modeling and Valuation
*Udemy - SQL - MySQL for Data Analytics and Business Intelligence
*Tableau 10 A-Z Hands-On Tableau Training For Data Science!
*Tableau Hands-on Learn Data Visualization with Tableau
*Udemy - Power BI A-Z Hands-On Power BI Training For Data Science
*Udemy - Machine Learning A-Z™ Hands-On Python & R In Data Science
*Udemy - Python for Financial Analysis and Algorithmic Trading Pls how can I locate you,if you don't mind I drop my number so we can chat 08155200577 1 Like |
| Re: Chronicle Of A Data Scientist/analyst by mcemmy0z: 9:25am On Jun 07, 2020 |
muzzling17:
Good day sir, pls I reside around Akute, but I can come to sango Ota to collect it. Thank you sir. Send me a pm 1 Like |
| Re: Chronicle Of A Data Scientist/analyst by nwele2017: 9:35am On Jun 07, 2020 |
Ejiod:
1. For quick analysis.
2. Referencing. I suggest you add XLOOKUP & XMATCH to your arsenals
3.Communicating with your lower team. You send the excel spreadsheet
4. Your boss may be interested in only the information based on the excel and not python
5. Quick charts.
6. Infact learn Google sheet as well.
7. Financial modeling for those on accounting
8. Conditional formatting
9. Split text column. Try go deep on data validations then you understand.
10. There are so many things you can do on Excel but not with pandas.
A typical person like me daily
1. Tableau
2. SQL
3. Excel
4. Google sheet
5. PowerPoint because you must present at least a month
6. Jupyter notebook
7. Rapid miner
Hope I answered your question. yes, you have.Thank you. am really grateful for all you have been doing here 1 Like |
| Re: Chronicle Of A Data Scientist/analyst by Zabiboy: 9:38am On Jun 07, 2020 |
Ejiod:
Seems you are yet to understand the power of Tableau and PowerBI.
Tableau being the king of Data visualization was and is so powerful that SalesForce acquired it for $15.7Billion. Only place matplotlib comes ahead is animation chart of which Tableau just released this year and they are already building ontop of it.
Even Excel can annotate not talk of Tableau or PowerBI or Google Data studio or Qlik
Thanks for the insight 
1 Like |
| Re: Chronicle Of A Data Scientist/analyst by yemyke001(m): 9:48am On Jun 07, 2020 |
Zabiboy:
Goto for data.world ( its a website)
Open an account
Search for @makeovermonday
This is 2020 week 23...this week's own would be posted later today but you can see previous weeks....
See the pic below
GL
Thanks man. I do appreciate 1 Like |
| Re: Chronicle Of A Data Scientist/analyst by yemyke001(m): 10:02am On Jun 07, 2020 |
noob03saibot:
Bro! Your head dey there abeg. Please can you drop a site where I can get exercises in csv to download for excel? And please want to ask if you can put me through on how to move excel files into mysql to finish work on them? Please man. Sql is really crazy, loving it so far Create a table in MYSQL, bearing the name of the columns in the excel file. Then right click on the table created (icon on your left) and import the csv/xlsx file to MYSQL. This should work. Although i do this with POSTGRESQL 2 Likes |
| Re: Chronicle Of A Data Scientist/analyst by nwele2017: 10:10am On Jun 07, 2020 |
donproject:
Been following your topic for a while now. I can reasonably call myself a data scientist but I must confess that you are making big waves. I've been in programming world generally for a while but I never heightened my game not until recently, thanks to Corona virus.
I've read your every single update and I know plus I've earnt most of the tools you've mentioned so far. I started off with web development packages and I can categorically say I'm a developer considerably.
I started learning data science early this year but was slow with it because I'm an engineering student at my final year, project and fighting to maintain my 4 pointer. But the recent pandemic affords me enough time, so all I do now is learning one thing or the other.
I raise my eyebrow whenever I see you mentioning and emphasising that one needs to know excel for free-following ML life, I do this because I'm yet to be convinced as to its importance. I will love it if you can stress out its indispensable value that makes it one of the tools one needs for data science (especially ML).
Then on web scrapping, I crawl sites with every tool suitable for it but scrapy. I know scrapy is an advanced module created for web scrapping, but I want to ask if it is so important to add to the tools used for web scrapping, I've scrapped a lot of sites without scrapy.
Finally [this is personal to me], like I've said that I've been around for a while, though I'm not in a rush to start earning before learning, I ride on with the faith that one day will be one day for me. But your stories here and many more I've read about young techies make me wonder if I'm doing things differently because I've been all alone in my programming world. You mentioned how you got a firm that hired you shortly after you start your programming journey, I must tell you this has greatly helped in your development. My question is, how did you manage to get those interviews and even the jobs in a very short period? May be it's due to the connections you've had or you are just in the right environment. Please I need you to answer this particular question even if you decline to answer others I've asked before. Thanks. I don't know why you guys like to compare beautifulSoup with scrapy. They are not comparable. Scrapy is a framework, comparing it with beautifulSoup is like comparing Django and Jinja ,that's if you know what that means. All am saying is that you should learn scrapy if you want to do serious and systematic scraping 1 Like |
| Re: Chronicle Of A Data Scientist/analyst by Regards2U: 10:46am On Jun 07, 2020 |
Electricboy:
bro, thank you for these materials ,but please do you have great books on permutation , combination and networking,I have been surfing the net looking books like that No but I would try and get it whenever I have data |
| Re: Chronicle Of A Data Scientist/analyst by Nobody: 10:50am On Jun 07, 2020 |
Regards2U:
No but I would try and get it whenever I have data OK thanks |
| Re: Chronicle Of A Data Scientist/analyst by Kaycee54321(m): 11:20am On Jun 07, 2020 |
Thanks Bosses |
| Re: Chronicle Of A Data Scientist/analyst by ogbiwa: 11:41am On Jun 07, 2020 |
Hardheolar:
Hi guys, I did further digging on the dataset that cochtrane scraped using a business intelligence tool called Power BI.
Note: The analysis is for the date when the thread made it to front page, not when it was created which spanned from 3rd of June 2019 to 2nd of June 2020 . The data has 28,516 threads from 38 different sections by 5025 different accounts.
Few insights from the dataset
-dre11 is the king of political threads with 361 threads followed by Islie(329) and ijustdey(225) during the time captured. Lala is more interested in celebrity threads compared to politics, followed by Alex. Ogbiwa is the defending champion of sports threads.
-Threads are mostly pushed to front page in the morning, which is reasonable since that is when the day begins.
-There was spike in threads that were pushed to front page in July 2019, but I can't tell if that is the norm during that period since we don't have previous year's data to make the comparison.
-You will think that threads in religion section should top the threads that make it to front page on Sundays, but it came third after politics and celebrity threads.
-853 threads made it to front page with "kill" keyword. That is worrisome and a cause of concern.
e.tc.
Lots of insight can be derived from the data.
Below is a link to the report. It is interactive, so feel free to play around with it.
https:///3gXsRlq I am? 1 Like |
| Re: Chronicle Of A Data Scientist/analyst by dauddy97(m): 12:19pm On Jun 07, 2020 |
Hardheolar:
The advent of coronavirus in March increased the number of posts hitting front page from health section as seen in the image attached below. 1,617 threads on coronavirus have made it to front page.
Instead of having the months start from January to December which might be confusing, I rearranged the months to show when the the data started from, which was June 2019. There has been a huge decline in the number of posts that made it to front page since December 2019 which slightly increased by 17% in March 2020 due to Covid.
The questions that needs to be answered are:
- was there a change in NL policy regarding the number of posts that hits front page?
- or the change in moderators during that period? Hello! I use tableau, can u share me the csv or excel file of this Nairaland dataset. let me do some Analysis too. 1 Like |
|
| Re: Chronicle Of A Data Scientist/analyst by noob03saibot(m): 3:14pm On Jun 07, 2020 |
Zabiboy:
1) kaggle . com...there are millions of dataset there...or if you are still learning, i advice you check out w3resource . com, bcz they drop solution to the exercises in case you are stuck somewhere..
2) We all love MySql bro....but only after you'v mastered it...I dont think you can move excel file into MySql...i tried that when i was learning back then but it didn't work...What you can do is to duplicate the excel file and change the extension to .sql and try importing the file....If it doesnt work, i suggest yoi google it.....This is one of the major advantage Pandas have over MySql..
GL
Thanks man for your swift response as usual. 1) at kaggle and w3 resource I will try visiting them. Hopefully, I would be able to download the csvs from there. Thanks. 2) but that's rather poor from mysql, it would have been great if they had incorporated that feature into it. I think the best bet for me then is creating tables in mysql and then moving it out to excel to do some quick analysis and then from there, panda(when I eventually start on panda). Thanks again. I am grateful. |
| Re: Chronicle Of A Data Scientist/analyst by noob03saibot(m): 3:16pm On Jun 07, 2020 |
yemyke001:
Create a table in MYSQL, bearing the name of the columns in the excel file. Then right click on the table created (icon on your left) and import the csv/xlsx file to MYSQL. This should work. Although i do this with POSTGRESQL Wow!!! This is something else, I will give it a try hopefully when power is restored by phcn. Though, it's mysql, but will give it a try. Thank you, I am grateful. |
| Re: Chronicle Of A Data Scientist/analyst by KunSegzy100(m): 3:31pm On Jun 07, 2020 |
mcemmy0z:
If getting job was so that easy will you have to wait for a year before getting a reply from a company. That was then when OP applied, I can boldly tell you there are many data analyst/scientist out there still looking for job, I have many of them on LinkedIn. Let's just base everything on God and grace. As far as Nigeria is concerned to get job here is not easy. nothing is easy, most esp in Nigeria, all on God 2 Likes |
| Re: Chronicle Of A Data Scientist/analyst by Samzeal(m): 4:42pm On Jun 07, 2020 |
cochtrane:
Download it here Please how can this dataset be arranged inform of table for easy access? |
| Re: Chronicle Of A Data Scientist/analyst by nwele2017: 5:27pm On Jun 07, 2020 |
Samzeal:
Please how can this dataset be arranged inform of table for easy access? Tableau will arrange it automatically for you. Tableau is so powerful such that it can recognise all data that have common attributes and but them in on field for. Also the data is comma separated, it will be easy to read |
| Re: Chronicle Of A Data Scientist/analyst by cochtrane(m): 5:43pm On Jun 07, 2020 |
Samzeal:
Please how can this dataset be arranged inform of table for easy access? How do you mean? The file format is csv. You just import it into whatever package you are using. |