News And Technical Analysis From Instaforex - Business (17) - Nairaland
Nairaland Forum / Nairaland / General / Business / News And Technical Analysis From Instaforex (45816 Views)
Get Startup Bonus Of $500 To Trade From Instaforex / News And Technical Analysis From Superforex / News From Instaforex (2) (3) (4)
(1) (2) (3) ... (14) (15) (16) (17) (18) (19) (20) ... (23) (Reply) (Go Down)
| Re: News And Technical Analysis From Instaforex by Instaforexbuk(f): 8:48am On Nov 15, 2018 |
Fundamental Analysis of AUD/USD for November 15, 2018 AUD/USD has been quite impressive with the recent bullish gains after the bounce off the 0.7150-0.7200 support area with a daily close. Despite recent positive economic reports from the US, AUD gained more momentum in the market due to upbeat employment data today. Today AUD Employment Change report was published with a significant increase to 32.8k from the previous figure of 7.8k which was expected to be at 19.9k and Unemployment Report was unchanged at 5.0% which was expected to increase to 5.1%. Moreover, RBA Assistant Governor Debelle spoke today about the housing lending issue. Besides, he addressed the repayment problems of the borrowers, so he suggested certain policies to reduce future shocks due to lending and monetary policy issues. On the other hand, recently US CPI report was published with an increase to 0.3% as expected from the previous value of 0.1% and Core CPI also increased to 0.2% as expected from the previous value of 0.1%. The readings were in line with expectations, however USD failed to gain momentum which indicates temporary weakness of the US currency. The market-moving event today is FED Chair Powell's speech which is expected to signal another rate hike this year. Thus, USD could find support from Powell's remarks before the weekend. Meanwhile, AUD is quite strong fundamentally and technically which might lead to certain gains in the pair, but there are still chances of USD to regain momentum as Powell's speech may contain the hawkish remarks which will encourage dollar bulls. If the US provides strong statistics in the coming days, further indecision and correction may persist in the market for longer. Otherwise, AUD may set a strong impulsive bullish trend in the future. Now let us look at the technical view. The price is currently pushing higher towards 0.7300 from where it has a probability to push lower towards 0.7150-0.7200 area. Though the recent price structure is in a range, further bullish pressure will persist with a target towards 0.7450-0.7500 resistance area in the future as the price breaks above 0.7300 with a daily close. As the price remains above 0.7150-0.7200 area, the bullish bias is expected to continue. SUPPORT: 0.7150, 0.7200 RESISTANCE: 0.7300, 0.7450, 0.7500 BIAS: BULLISH MOMENTUM: IMPULSIVE 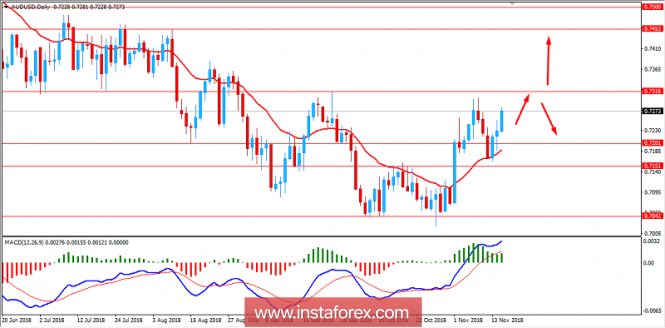 Read more: https://www.instaforex.eu/forex_analysis/128036 |
| Re: News And Technical Analysis From Instaforex by Instaforexbuk(f): 8:51am On Nov 16, 2018 |
GBP / USD Forecast for November 16, 2018 GBP / USD The tragedy of the British pound on Thursday broke out rapidly. Brexit Minister Dominic Raab and Northern Ireland Affairs Sheiles Vara, resigned due to disagreement with the Prime Minister's position on the EU deal. In turn, Teresa May confirmed her intention to leave the EU no later than March 29, 2019. The data on October retail sales were pessimistic: -0.5% against expectations of a 0.2% growth after the September decline of -0.4%. In the US, retail sales showed an increase of 0.8%. As a result, the pound sterling collapsed by 214 points. 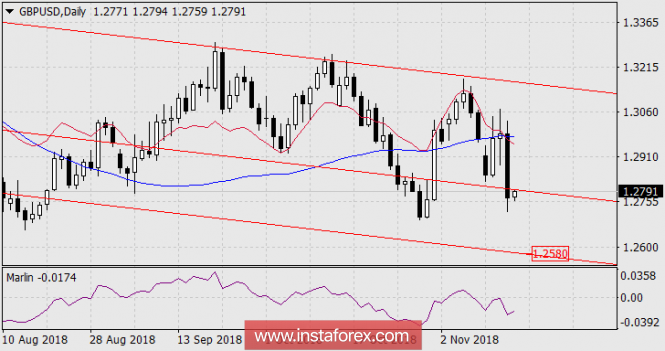 On the daily scale chart, the price went under the trend line of the price channel. In both charts - daily and H4, there is not a single sign for price reversal up except that convergence with the Marlin oscillator on the four-hour chart. But in this case, the pattern can be taken as an artifact as a tool's reaction to previous strong movements. The volume of industrial production in the US in October today may show an increase of 0.2%. We ook forward to further decline of the pound to support the underlying trend line in the area of 1.2580. Read more: https://www.instaforex.eu/forex_analysis/218803 |
| Re: News And Technical Analysis From Instaforex by xfabulous(m): 12:36pm On Nov 16, 2018 |
Hahah |
| Re: News And Technical Analysis From Instaforex by Instaforexbuk(f): 8:05am On Nov 19, 2018 |
Indicator analysis. Daily review for November 19, 2018 for the pair GBP / USD The price on Friday rally down worked out the top. Bears were fixing profits, and the market broke off the support line 1.1248 (red thick line). On Monday, there is no strong calendar news. Most likely, the bears once again try to resume movement down. Trend analysis (Fig. 1).  On Monday, the price will move downward with the first target 1.2751 - the support line (red thick line). Fig. 1 (daily schedule). Comprehensive analysis: - indicator analysis - down; - Fibonacci levels - neutral; - volumes - down; - candlestick analysis is neutral; - trend analysis - up; - Bollinger lines - up; - weekly schedule - up. General conclusion: On Monday, the price will move downward with the first target 1.2751 - the support line (red thick line). Read more: https://www.instaforex.com/forex_analysis/218907 |
| Re: News And Technical Analysis From Instaforex by Instaforexbuk(f): 8:50am On Nov 21, 2018 |
Forecast for USD / JPY for November 21, 2018 USD / JPY In the last yen review of the 19th, we considered the option of a false breakdown by the Krusenstern line on a daily scale. Such a false breakdown really took place, but with a delay of two days. And yesterday, the yen rose by 21 points against the fall of the US stock market by 1.82%. The optimism and perseverance of investors are explained by the fact that the fall was not systemic due to the collapse of several technology companies which pulled the market down. Today, the Chinese index China A50 is growing at 0.12%. We have to wait for the growing trend of the yen to consolidate. The first such sign will be the departure of the price above the nearest line of the price channel on the daily chart. There are only 10 points left. 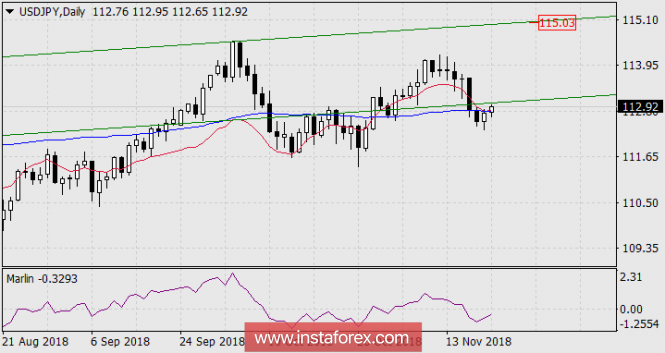 On the H4 chart, the Marlin oscillator is growing. The price tends to the Krusenstern line to the area of 113.65. With the overcoming of resistance, the second goal of 115.03 is opened - resistance of the price channel line on the daily chart. 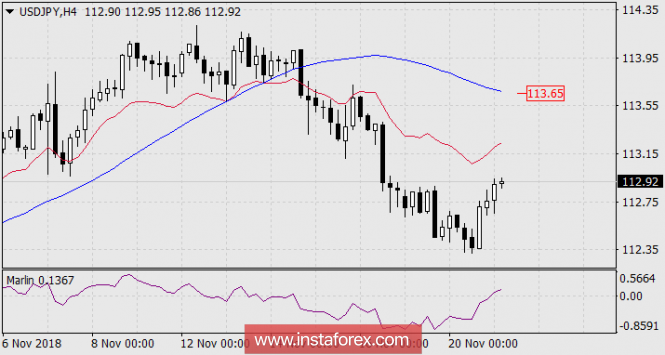 |
| Re: News And Technical Analysis From Instaforex by Instaforexbuk(f): 7:53am On Nov 26, 2018 |
GBP / USD Forecast for November 26, 2018 GBP / USD The trading volume on the British pound on Friday was the smallest in the last 3 months. Under the general pressure of the dollar (USDH 0.46%) and in anticipation of the decision of the EU emergency meeting on Brexit, the pound lost 64 points. On Sunday, the EU countries unanimously adopted the Brexit plan. In England, the opposition,in particular the Labor Party, spoke out against voting on this draft in Parliament and suggested either changing the text of the treaty or holding a second Brexit referendum. On the other hand, EU representatives replied that there would be no second agreement on the UK leaving the EU, that is, under the most extreme scenario, England would leave the EU without a deal. It seems to us that the treaty will still be ratified until December 25 as required. But we do not expect significant growth of the pound in this case, since in fact, the United Kingdom will still acquire small restrictions. Probably, there will be no growth at all - as the working out of the exchange phenomenon of selling on the facts. In the current situation, we are waiting for the price to overcome the support of the price channel line on the daily timeframe at about 1.2777. After that, we are waiting for the further decline of the pound to the underlying line in the 1.2560 area. 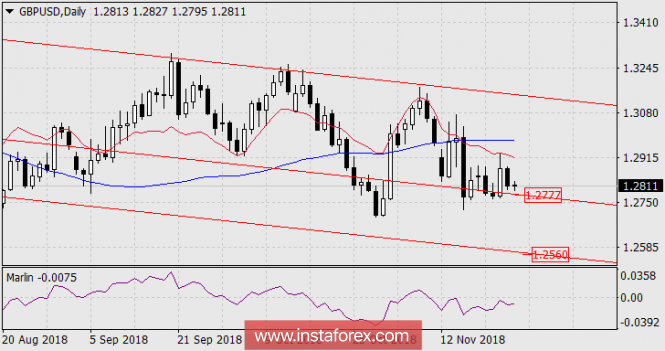 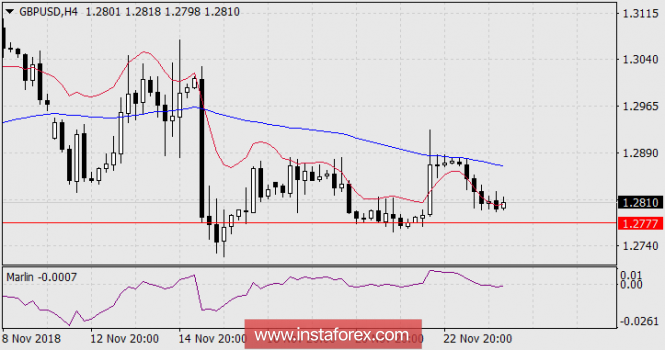 |
| Re: News And Technical Analysis From Instaforex by Instaforexbuk(f): 8:44am On Nov 27, 2018 |
Technical analysis for Gold for November 27, 2018 Gold price is slowly and steadily turning lower and away from the resistance area and major trend change level of $1,243.50 after topping around $1,230. Gold price has given some bearish divergence signs and according to our plan and expectations is turning lower. 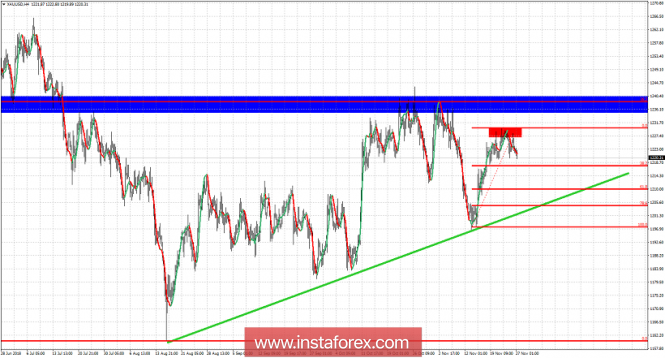 Blue rectnagle -major resistance Red rectangle - short-term resistance Green line - major trend line support Gold price looks like it has finished the bounce from $1,196 at $1,230. Price should at least pull back towards $1,218 if not $1,210. As I said in previous posts I remain bearish below $1,243.50. If we see price break below the green trend line then the chances of moving below $1,180 will increase dramatically. If price holds above $1,210-$1,200 area then we could see another strong bounce towards $1,240. For now we remain bearish as the bounce is over and we are due for a pull back if not a new downward trend to new lows. Read more: https://www.instaforex.com/forex_analysis/128987 |
| Re: News And Technical Analysis From Instaforex by Instaforexbuk(f): 8:31am On Nov 28, 2018 |
GBP / USD Forecast for November 28, 2018 GBP / USD On Tuesday, the British pound fell by 71 points under pressure from the dollar (USDX 0.32%) and previous concerns about the ratification of the UK exit from the EU. Looking at the daily chart, the price went under the signal level of the embedded trend line of the price channel in which the target 1.2558 became relevant. Today, the 2nd estimate of the US GDP for the 3rd quarter is released. The indicator is expected to be revised from 3.5% to 3.6%. Tomorrow, the UK will issue lending data for October, since it is expected to decrease in the volume of loans to individuals from 4.7 billion pounds to 4.5 billion. On the four-hour chart, the price is fixed below the balance line (red) and Krusenstern line (blue) - the current downward trend. 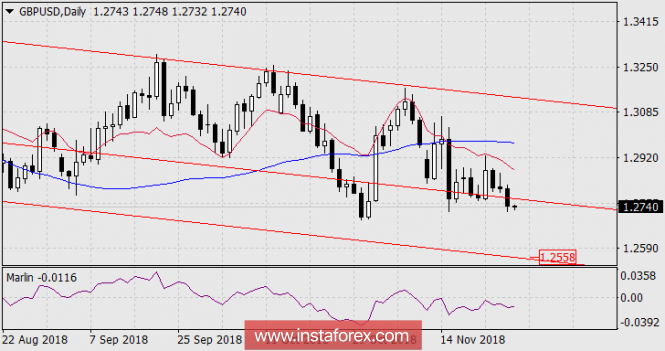 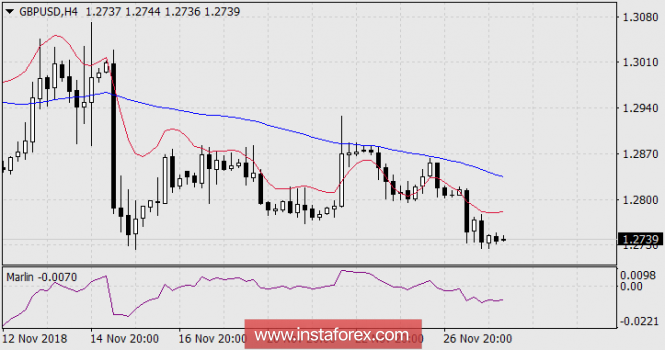 |
| Re: News And Technical Analysis From Instaforex by Instaforexbuk(f): 7:48am On Nov 29, 2018 |
BITCOIN Analysis for November 28, 2018 Bitcoin has been quite impulsive with the bullish gains recently which lead the price to reside at the edge of $4,250 area breaking above $4,000 area. The price is currently being held by the dynamic level of 200 EMA from where it is expected to push lower having Bearish Continuous Divergence emerging recently. The price is being supported by the dynamic levels of 20 EMA, Tenkan, and Kijun line. On the back of current volatility and bearish pressure, BTC is likely to regain the bearish momentum which will lead the price towards $3,000 area in the future. As the price remains below $4,500 area with a daily close, the impulsive bearish bias is expected to continue. SUPPORT: 3,500, 4,000 RESISTANCE: 4,250, 4,400, 4,500 BIAS: BEARISH MOMENTUM: VOLATILE 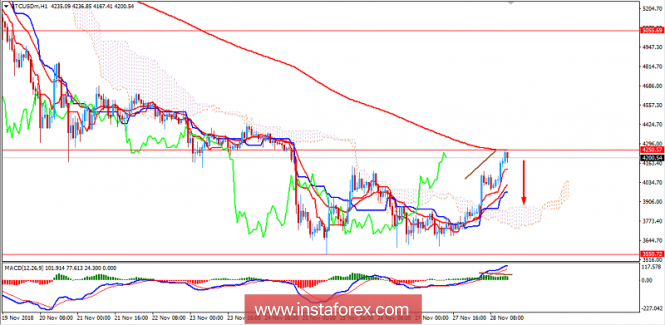 Read more: https://www.instaforex.com/forex_analysis/129178 |
| Re: News And Technical Analysis From Instaforex by Instaforexbuk(f): 8:30am On Nov 30, 2018 |
Technical analysis: Intraday Level For EUR/USD for November 30, 2018 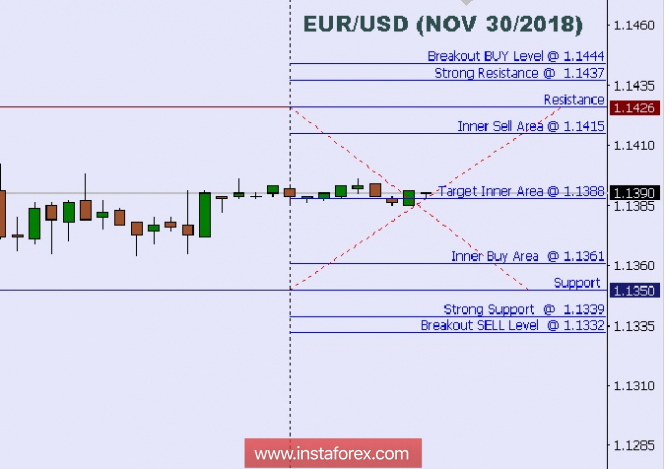 When the European market opens, some economic data will be released such as Unemployment Rate, Core CPI Flash Estimate y/y, Italian Prelim CPI m/m, CPI Flash Estimate y/y, Italian Monthly Unemployment Rate, French Prelim CPI m/m, German Retail Sales m/m, and German Import Prices m/m. The US will also publish the economic data such as Chicago PMI, so amid the reports, the EUR/USD pair will move in a low to a medium volatility during this day. TODAY'S TECHNICAL LEVEL: Breakout BUY Level: 1.1444. Strong Resistance:1.1437. Original Resistance: 1.1426. Inner Sell Area: 1.1415. Target Inner Area: 1.1388. Inner Buy Area: 1.1361. Original Support: 1.1350. Strong Support: 1.1339. Breakout SELL Level: 1.1332. Disclaimer: Trading Forex (foreign exchange) on margin carries a high level of risk, and may not be suitable for all Traders or Investors. The high degree of leverage can work against you as well as for you. Before deciding to invest in foreign exchange, you should carefully consider your investment objectives, level of experience, and risk appetite. The possibility exists that you could sustain a loss of some or all of your initial investment and therefore you should not invest money that you cannot afford to lose. You should be aware of all the risks associated with foreign exchange trading, and seek advice from an independent financial advisor if you have any doubts. Read more: https://www.instaforex.com/forex_analysis/129307 |
| Re: News And Technical Analysis From Instaforex by Instaforexbuk(f): 8:57am On Dec 03, 2018 |
Technical analysis for EUR/USD for December 3, 2018 EUR/USD got rejected at the upper trend line resistance of 1.14 on Friday and pulled back towards 1.13. Price is now bouncing back up again but so far we have no break out. Longer-term trend remains bearish. Short-term trend is neutral. 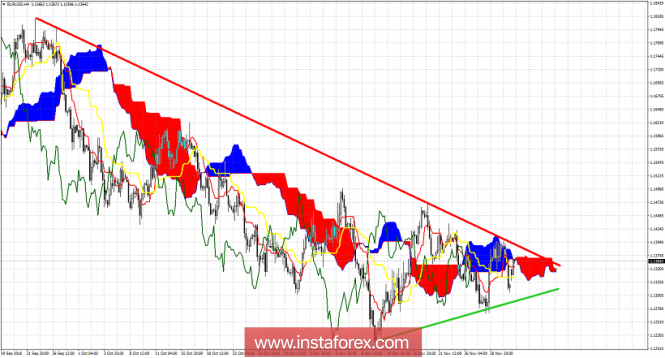 Red line - major resistance Green line - major support EUR/USD is challenging Ichimoku cloud resistance but even if it breaks above the cloud, the most important resistance to break is the red trend line. So far price has been rejected twice. Will we see a third and final rejection or will we see a breakout and a move to 1.16? As long as we trade below last week's highs bears have the upper hand. Important short-term support is found at Friday's lows. Breaking below this level will push price below the green trend line support and most probably towards 1.11-1.12. Being trapped inside this triangle offers no clear view for the medium-term trend in EUR/USD. Traders need to be patient. Read more: https://www.instaforex.com/forex_analysis/129420 |
| Re: News And Technical Analysis From Instaforex by Instaforexbuk(f): 8:40am On Dec 04, 2018 |
Global macro overview for 04/12/2018 erome Powell did not comment on monetary policy, but he mentioned a strong economy. He assured us that the Federal Reserve mission is to support economics and strengthen the financial system. According to him, the Fed managed to achieve this goal. The unemployment rate is the lowest in almost half a century. Apart from the labor market, the strength of the economy is also visible in other areas - higher wages, higher household assets and consumer confidence in supporting expenses. Importantly, wages should now increase even faster. Productivity has also increased, but it is not known if this is a constant trend. The other FOMC representatives have recently underlined the transition to a stronger dependence of their decisions on data, which revived the debate about the scale of increases next year. Such a change in communication from the Fed was received as an invitation to contest the FOMC projection, assuming five more hikes in the cycle (taking into account the decided raising of rates in December). The change in the Fed's bias enforces a change in the market approach, which will not be ready to price further moves in advance, regardless of how many of them will ultimately be theirs. Let's now take a look at the US Dollar Index technical picture at the H4 time frame. The market has failed to rally above the recent swing high at the level of 97.51, so the price has reversed towards the technical support at the level of 96.63 - 96.71 zone and is currently testing it. Any breakout below this zone will open the road towards the next support at the level of 96.40 and 96.32. Weak and negative momentum supports the short-term bearish outlook. 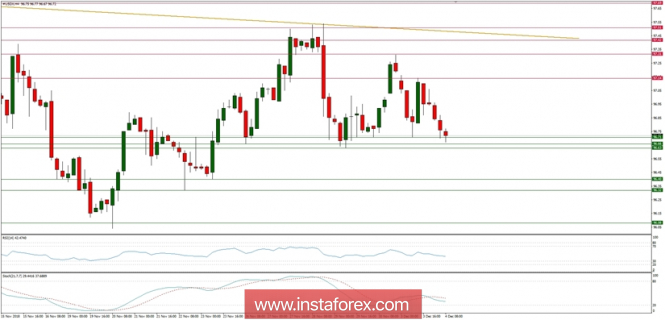 Read more: https://www.instaforex.com/forex_analysis/129517 |
| Re: News And Technical Analysis From Instaforex by Instaforexbuk(f): 8:27am On Dec 05, 2018 |
EUR/AUD Reversed Off Resistance, Prepare For Further Drop EUR/AUD reversed off its resistance at 1.5520 (61.8% Fibonacci extension, 38.2% Fibonacci retracement, horizontal overlap resistance) where it is expected to drop further to its support at 1.5431 (61.8% Fibonacci extension, 61.8% Fibonacci retracement, horizontal swing low support). Stochastic (55, 5, 3) reversed off its resistance at 94% where a corresponding drop is expected. EUR/AUD reversed off its resistance where we expect to see a further drop. Sell below 1.5520. Stop loss at 1.5579. Take profit at 1.5431. 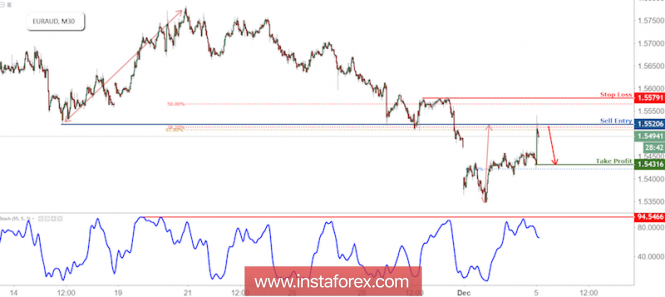 Read more: https://www.instaforex.com/forex_analysis/129600 |
| Re: News And Technical Analysis From Instaforex by Instaforexbuk(f): 8:48am On Dec 11, 2018 |
Technical analysis for Gold for December 11, 2018 Today we take a look at the weekly chart of Gold. Gold price made an important low back in August and since then it is rising. There is potential to move towards $1,300 again but losing $1,200, could be disastrous for bulls. 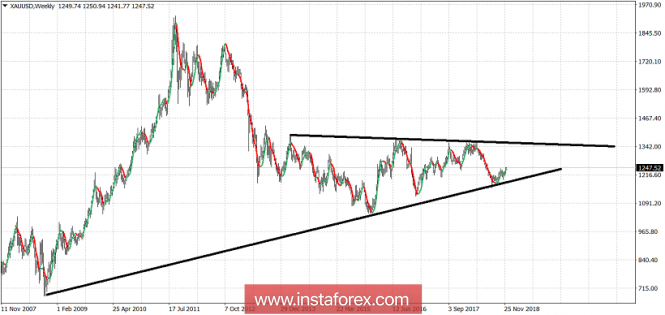 Gold has made a double top on a weekly basis around $1,340-50 area. This is a major resistance level. Breaking above it would open the way for a move towards $1,450-$1,500. Gold during September tried to make a higher high but got rejected. This was a bearish sign of weakness. However the pull back respected the upward sloping trend line and did not make a lower low. Gold price is now bouncing off the upward sloping trend line once again and this could unfold into a bigger rally towards the upper trend line resistance. In the short-term Gold is heading towards $1,250-60 or higher towards $1,285 where we find the 61.8% Fibonacci retracement of the entire decline. As long as Gold price is trading above $1,200-$1,220 bulls remain in control of the trend. If that level fails to hold, we should expect heavy selling to push prices towards $1,000 or lower. Read more: https://www.instaforex.com/forex_analysis/130123 |
| Re: News And Technical Analysis From Instaforex by Instaforexbuk(f): 8:56am On Dec 12, 2018 |
Technical analysis for EUR/USD for December 12, 2018 EURUSD once again got rejected at the 1.14-1.1420 resistance area and is now pulling back towards 1.13 short-term support. So far every new low after the May low at 1.1510, has been weaker according to the Daily RSI. For this bullish pattern to be confirmed bulls will need to break above 1.14 and stay above it. 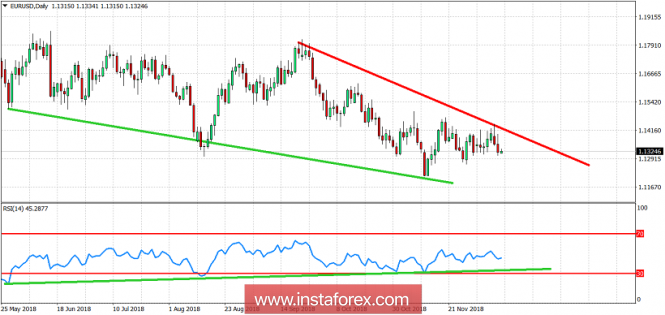 Green lines - bullish divergence Red line - trend line resistance EURUSD is trading above 1.13. Support is here and next at 1.1270. Losing 1.1270 could push price towards 1.1170. Resistance remains at 1.14-1.1420. Breaking above it would be a bullish reversal signal and could push prices towards 1.16 at least. Trend is bearish below 1.14 and bullish above it. Simple as that. Read more: https://www.instaforex.com/forex_analysis/130212 |
| Re: News And Technical Analysis From Instaforex by Instaforexbuk(f): 6:43am On Dec 13, 2018 |
Technical analysis: Intraday level for USD/JPY for December 13, 2018 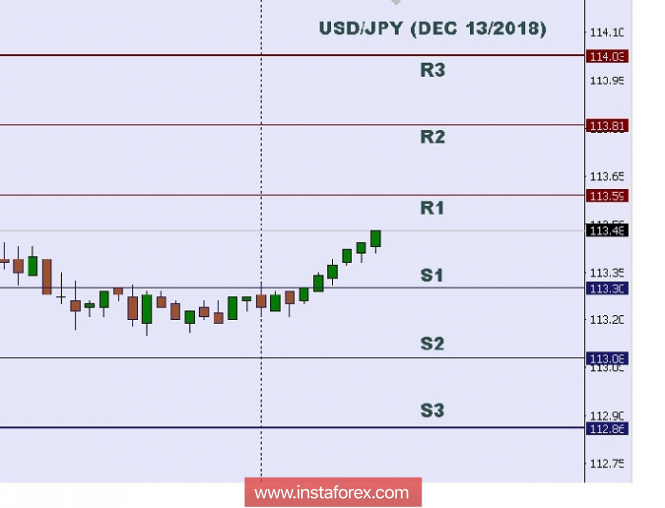 In Asia, Japan will not release any economic data today, but the US will publish some economic data such as 30-y Bond Auction, Natural Gas Storage, Unemployment Claims, and Import Prices m/m. So there is a probability that the USD/JPY pair will move with a low to a medium volatility during this day. TODAY'S TECHNICAL LEVEL: Resistance. 3: 114.03. Resistance. 2: 113.81. Resistance. 1: 113.63. Support. 1: 113.30. Support. 2: 113.08. Support. 3: 112.86. Disclaimer: Trading Forex (foreign exchange) on margin carries a high level of risk, and may not be suitable for all Traders or Investors. The high degree of leverage can work against you as well as for you. Before deciding to invest in foreign exchange, you should carefully consider your investment objectives, level of experience, and risk appetite. The possibility exists that you could sustain a loss of some or all of your initial investment and therefore you should not invest money that you cannot afford to lose. You should be aware of all the risks associated with foreign exchange trading, and seek advice from an independent financial advisor if you have any doubts. Read more: https://www.instaforex.com/forex_analysis/130304 |
| Re: News And Technical Analysis From Instaforex by Instaforexbuk(f): 7:01am On Dec 14, 2018 |
Technical analysis: Intraday Level For EUR/USD for December 14, 2018 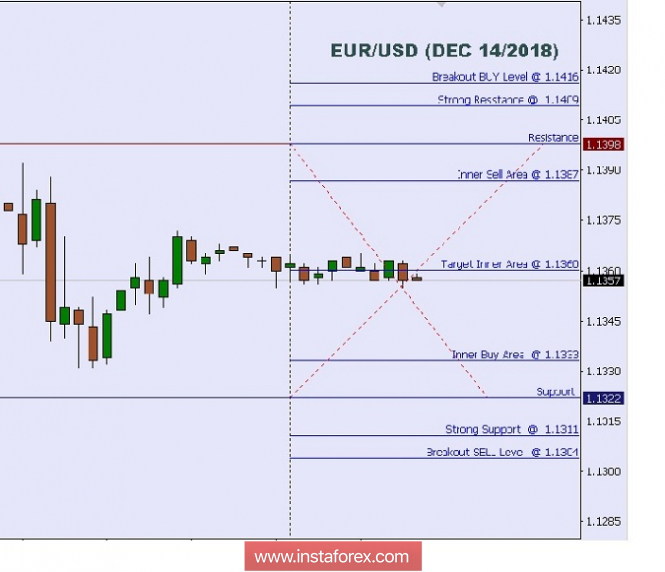 When the European market opens, some economic data will be released such as Core Retail Sales m/m, Flash Manufacturing PMI, Flash Manufacturing PMI, German Flash Services PMI, German Flash Manufacturing PMI, French Flash Services PMI, French Flash Manufacturing PMI, and German WPI m/m. The US will also publish the economic data such as Business Inventories m/m, Flash Services PMI, Flash Manufacturing PMI, Industrial Production m/m, Capacity Utilization Rate, Retail Sales m/m, and Core Retail Sales m/m, so amid the reports, the EUR/USD pair will move in a low to a medium volatility during this day. TODAY'S TECHNICAL LEVEL: Breakout BUY Level: 1.1416. Strong Resistance: 1.1409. Original Resistance: 1.1398. Inner Sell Area: 1.1387. Target Inner Area: 1.1360. Inner Buy Area: 1.1333. Original Support: 1.1322. Strong Support: 1.1311. Breakout SELL Level: 1.1304. Disclaimer: Trading Forex (foreign exchange) on margin carries a high level of risk, and may not be suitable for all Traders or Investors. The high degree of leverage can work against you as well as for you. Before deciding to invest in foreign exchange, you should carefully consider your investment objectives, level of experience, and risk appetite. The possibility exists that you could sustain a loss of some or all of your initial investment and therefore you should not invest money that you cannot afford to lose. You should be aware of all the risks associated with foreign exchange trading, and seek advice from an independent financial advisor if you have any doubts. Read more: https://www.instaforex.com/forex_analysis/130423 |
| Re: News And Technical Analysis From Instaforex by Instaforexbuk(f): 8:32am On Dec 17, 2018 |
Forecast for USD/JPY on December 17, 2018 USD/JPY On Friday, moderately optimistic quarterly indicators of Japan's business activity (Tankan) was released, but the fall of stock indices in the US did not allow the yen to develop growth. The Tankan Manufacturing Index for the 4th quarter remained unchanged at 19 points, against the forecast of a decline to 18 points. The Tankan Non-Manufacturing Index rose from 22 to 24 against the forecast of a decline to 21. The December Manufacturing PMI grew from 52.2 to 52.4. The deterioration was shown by Chinese data, which, in fact, affected the stock market, which now partly shows the prospects of China's relations with the United States. China's industrial production in November declined from 5.9% yoy to 5.4% yoy, retail sales pursed from 8.6% y/y to 8.1% y/y. the S&P 500 has decreased by 1,91%, the yen by 23 points. Nevertheless, the trend line of the price channel and the indicator balance line of the daily time frame proved to be a strong support. Today in the Asian session the price is already showing growth. Over the weekend, the calm came to the stock markets – Asian indices are growing; Nikkei 225 0.66%, S & P/ASX 200 0.84%. Chinese indexes albeit slower, but also recovering: China A50 -0,16%, Shanghai Composite is 0.01%. We expect the price to overcome the resistance of the upper limit of the falling price channel (113.85) and further increase to the resistance of the rising price channel – 115.25.
|
| Re: News And Technical Analysis From Instaforex by Instaforexbuk(f): 8:56am On Dec 18, 2018 |
USD/CHF Approaching Support, Prepare For A Bounce The USD/CHF pair is approaching its support at 0.9909 (100% Fibonacci extension, 61.8% Fibonacci retracement, horizontal overlap support) where it could potentially bounce to its resistance at 0.9946 (50% Fibonacci retracement, horizontal swing high resistance). Stochastic (55, 5, 3) is nearing its support at 4.6% where a corresponding bounce could occur. USD/CHF is approaching its support where we expect to see a bounce. Buy above 0.9909. Stop loss at 0.9887. Take profit at 0.9946. 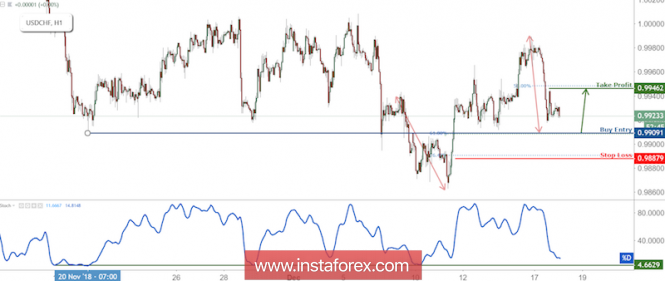 Read more: https://www.instaforex.com/forex_analysis/130655 |
| Re: News And Technical Analysis From Instaforex by Instaforexbuk(f): 9:04am On Dec 19, 2018 |
Global macro overview for 19/12/2018 The Prime Minister of Great Britain canceled the parliamentary vote, which was scheduled for December 11th and announced on Monday that the final agreement will be put to the vote on January 14. The leader of the opposition Labor Party, Jeremy Corbyn, said that May has long been avoiding accountability in the parliament. He proposed a motion of censure for Theresa May as the prime minister, citing her "failure", which did not give her a chance to vote on a package of parting with the EU she negotiated. May, however, gained the confidence of the parliament. Theresa May responded in the parliament: "I know this is not everyone's perfect deal. It is a compromise. But if we let the perfect be the enemy of the good then we risk leaving the EU with no deal". This means that negotiating better, even ideal conditions can lead to a deterioration of the situation and leave the Union without a cooperation agreement. "Avoiding no deal is only possible if we can reach an agreement or if we abandon Brexit entirely." She said the EU had offered "further clarification" on the most contentious aspects of the withdrawal agreement and her government was seeking "further political and legal assurances". The UK - EU divorce negotiations are still on the table then, so let's take a look at the GBP/USD technical picture at the H4 time frame chart. The market has retraced 61% at the level of 1.2706 and reversed towards the nearest technical support at the level of 1.2659 with a low at the level of 1.2620. Since then the price is hovering around this level, but the momentum remains strong and positive, so there is still a chance for another spike higher to test the level of 1.2706 again. In the case of a further breakout, the market will likely move towards the level of 1.2795.
|
| Re: News And Technical Analysis From Instaforex by Instaforexbuk(f): 7:29am On Dec 20, 2018 |
[size=14pt]Technical analysis: Intraday level for USD/JPY for December 20, 2018 [/size] Company does not offer investment advice and the analysis performed does not guarantee results In Asia, Japan will release the All Industries Activity m/m, Monetary Policy Statement, and BOJ Policy Rate. The US will also publish some economic data such as Natural Gas Storage, CB Leading Index m/m, Unemployment Claims, and Philly Fed Manufacturing Index. So there is a probability that the USD/JPY pair will move with a low to a medium volatility during this day. TODAY'S TECHNICAL LEVEL: Resistance. 3: 113.00. Resistance. 2: 112.78. Resistance. 1: 112.56. Support. 1: 112.29. Support. 2: 112.07. Support. 3: 111.85. Disclaimer: Trading Forex (foreign exchange) on margin carries a high level of risk, and may not be suitable for all Traders or Investors. The high degree of leverage can work against you as well as for you. Before deciding to invest in foreign exchange, you should carefully consider your investment objectives, level of experience, and risk appetite. The possibility exists that you could sustain a loss of some or all of your initial investment and therefore you should not invest money that you cannot afford to lose. You should be aware of all the risks associated with foreign exchange trading, and seek advice from an independent financial advisor if you have any doubts. Read more: https://www.instaforex.eu/forex_analysis/130883
|
| Re: News And Technical Analysis From Instaforex by Instaforexbuk(f): 8:04am On Dec 21, 2018 |
Elliott wave analysis of EUR/NZD for December 21, 2018 The correction in the wave iv should be close to its end. Ideally, we will see a final spike above 1.7015 where a peak of a new impulsive decline in the wave v towards 1.6166 is expected. In the short-term, a break below minor support at 1.6777 will be a strong indication that the wave iv correction is completed, while a break below support at 1.6533 will confirm that the wave v is developing. R3: 1.7071 R2: 1.7015 R1: 1.6965 Pivot: 1.6921 S1: 1.6878 S2: 1.6777 S3: 1.6725 Trading recommendation: We will sell EUR at 1.7010 or, after a break, below 1.6777. Read more: https://www.instaforex.eu/forex_analysis/131017
|
| Re: News And Technical Analysis From Instaforex by Instaforexbuk(f): 10:32am On Dec 24, 2018 |
The forecast for AUD / USD for December 24, 2018 AUD / USD The Australian dollar on Friday met the minimum plan and reached the target level of 0.7042. Today, on a shorter working day in Australia and in the West, investors just close their positions before the holidays. On the four-hour chart, there are first signs of price convergence with the Marlin indicator, which may indicate the potential for corrective growth. Upon completion of the correction, which is the maximum (as far as possible to continue in a declining trend) can continue to 0.7125, we are waiting for the resumption of the decline to support the embedded line in the price channel in the area of 0.6998.
|
| Re: News And Technical Analysis From Instaforex by Instaforexbuk(f): 9:42am On Dec 27, 2018 |
GBP/USD: plan for the European session on December 27. Trade remains in the channel Company does not offer investment advice and the analysis performed does not guarantee result To open long positions on GBP/USD you need: Buyers of the pound failed to stay at weekly highs, which led to the return of the pair to the area of the lower boundary of the side channel. At the moment, bulls urgently need to return to the resistance of 1.2668, which acts as the middle of the channel. Only in such a scenario, the demand for the pound will return, which will lead to an update of the upper boundary of the side channel of 1.2715, where I recommend taking profits. In the event of a further decline in GBP/USD, only a test of the support range of 1.2615-1.2620 can return buyers to the market. Otherwise, you can open long positions immediately to rebound from a low of 1.2567. To open short positions on GBP/USD you need: Sellers will try to keep the pair below the resistance of 1.2668, and the formation of a false breakdown there will be a direct signal to sell the pound with access to the lower boundary of the channel of 1.2620, where the first profit taking will be. Larger sellers will count on updating the new weekly low around 1.2567, where I recommend taking profits. In case of growth above 1.2668 in the first half of the day, short positions can be considered to rebound from 1.2715. Indicator signals: Moving averages Trade is conducted just below the 30-day and 50-day moving average, with the short-term advantage of sellers of the British pound. Bollinger bands In the event of a decrease in the pound, support will be provided by the lower limit of the Bollinger Bands indicator in the area of 1.2625, from which you can open long positions. The upward trend may be limited by the upper limit of the channel of 1.2690, from where sellers of the pound will return to the market. Read more: https://www.instaforex.eu/forex_analysis/221541
|
| Re: News And Technical Analysis From Instaforex by Instaforexbuk(f): 9:18am On Dec 28, 2018 |
Forecast for USD/JPY for December 28, 2018 Company does not offer investment advice and the analysis performed does not guarantee results USD/JPY Despite the recovery of the US stock market (even if it is still unstable), the yen could not withstand the pressures of Japanese economic statistics this morning and turned down from the key level of 111.40, the overcoming of which would be a condition for growth by 112.30. The unemployment rate increased from 2.4% to 2.5%, industrial production in November fell by 1.1%, retail sales slowed from 3.6% y/y to 1.4% y/y Japan's Nikkei 225 loses in the Asian session of 0.84%. On the four-hour chart, the price turned down from the balance line. The transition of the Marlin oscillator to the negative zone will allow the price to develop a downward movement in the range of 109.38/79 (lows June 25 and August 21).
|
| Re: News And Technical Analysis From Instaforex by Instaforexbuk(f): 8:30am On Jan 02, 2019 |
Global macro overview for 02/01/2019 Investors are still not sure whether the cuts in production declared by the OPEC countries and its allies will be able to counteract the dynamically growing oil production in the US. Concern about the impact on US economic growth is also caused by the ongoing trade dispute between the US and China, as well as the monetary policy of the Fed. The US President Trump prevailed this year as an oil price regulator because he was involved in everything - from sanctions against Iran and the ban on Iranian oil imports, through Washington's trade war with Beijing, to tension in relations with Saudi Arabia. Although oil prices have stopped falling, their growth rate next year may also be only a gradual. In this quarter, WTI crude oil in the US drops almost 38% while back in 2018, WTI crude oil on NYMEX has so far decreased by 24%, after a rise in the previous two years by over 60%. Brent lost 35% in the fourth quarter, and finished the year with a loss of 19.5%. Let's now take a look at the Crude Oil technical picture at the H4 time frame. There is a big, unfilled gap down between the levels of 45.62 - 52.22 and despite the extremely oversold market conditions, the bulls are so far too weak to fill the gap. After a shallow bounce, the local high was made at the level of 46.95 and since then the market is locked between the levels of 44.30 - 46.95 as it trades horizontally. The next technical resistance is seen at the level of 49.40, the nearest support is seen at the local swing low at 42.04. 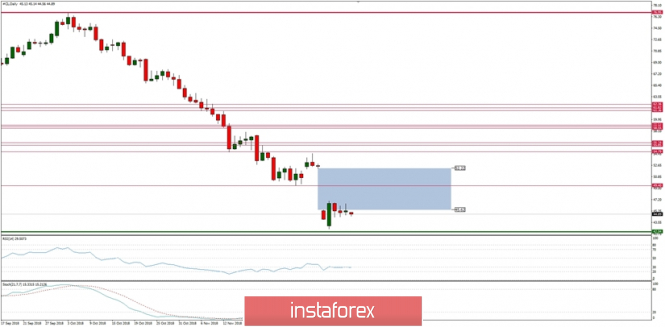 Read more: https://www.instaforex.eu/forex_analysis/131639 |
| Re: News And Technical Analysis From Instaforex by Instaforexbuk(f): 9:06am On Jan 03, 2019 |
Ethereum analysis for 03/01/2019 Ethereum (ETH) defeated Ripple (XRP), and regained its position as the largest altcoin in terms of market capitalization, give data from CoinMarketCap. During the recent upsurge of the twenty largest cryptocurrencies, Ethereum - who spent many weeks on site number three - suddenly emerged again, exceeding the market capitalization of XRP by over $ 500,000. This movement seems to be connected with fresh controversies both for XRP and its relationship with the Ripple payment network. The confusion about whether Ripple can make executive decisions in relation to XRP appeared this week in the mainstream media after the US cryptocurrency exchange - Kraken - publicly asked a senior manager for advice on how to name a cryptocurrency. Let's now take a look at the ETH/USD technical picture at the H4 time frame. The market has broken above the dashed black trend line and then broken above the level of 146.04 which will now act as local technical support for the price. Currently, the market is consolidating the gains and the next target for bulls is seen at the level of 155.06. The strong and positive momentum supports the short-term bullish outlook. 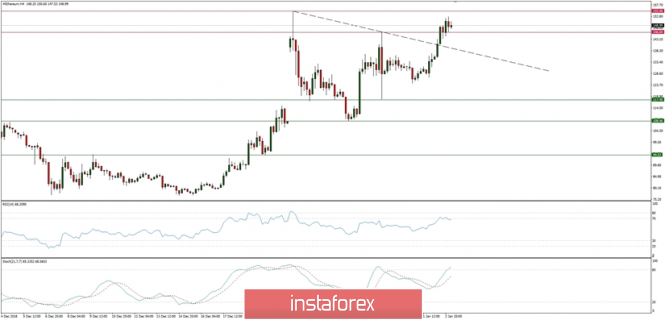 Read more: https://www.instaforex.eu/forex_analysis/131752 |
| Re: News And Technical Analysis From Instaforex by Instaforexbuk(f): 8:52am On Jan 04, 2019 |
Bitcoin analysis for 04/01/2019 Statistical data from Blockchain and Bitcoin Wisdom confirm that the latest correction of the Bitcoin mining difficulty level has increased by almost 10 percent. "Difficulty" refers to the ease with which miners can solve equations to validate a block of transactions in Bitcoin Blockchain. The period from July brought recurring downward adjustments because Bitcoin's price dropped and miners needed lower costs to avoid losses. This year there were five downward revisions - one in July, one in October, one in November and two in December. The biggest change took place on December 3 - it was 15.1%. At that time BTC / USD was under strong pressure, due to the fact that the miners abandoned the network massively due to problems with profitability. Hashrate experienced declines since August, but the reduced difficulty caused a recovery around mid-December, which for some was a demonstration of Bitcoin's ability to take care of himself without central power. Meanwhile, many Bitcoin developers emphasized the decentralized nature of Bitcoin as something that would increase his "separation" from altcoins in 2019. Let's now take a look at the Bitcoin technical picture at the H4 time frame. The market has not moved much since the bounce from 50% Fibo at $3,643 and a failure to break through the technical resistance at $3,850. Currently, the price is consolidating around the level of $3,774 with the neutral market conditions. The nearest technical support is seen at the level of $3,595. 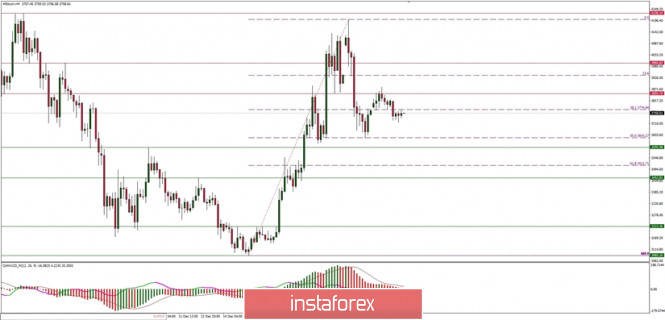 Read more: https://www.instaforex.eu/forex_analysis/131855 |
| Re: News And Technical Analysis From Instaforex by Instaforexbuk(f): 8:20am On Jan 07, 2019 |
Global macro overview for 07/01/2019 The US labor market report for December is solid. Employment in the non-agricultural sector increased by as much as 312,000, against a consensus at 184,000, and even against the most optimistic forecasts (225,000). This is the largest monthly increase since February of last year and suggests that the US economy has no problems with creating jobs. The global investors also got evidence of rising wage pressure, as salaries increased by 0.4% m / m, by 0.1 percentage point above forecasts. The unexpected increase in the unemployment rate at first glance looks negative, but it can also be evidence of the return of the unemployed to active job search, which would indicate a positive perception of the state of the economy. Let's now take a look at the EUR/USD technical picture at the H4 time frame. The market has a positive response to the data. EUR / USD in the first reaction fell by 40 pips to 1.1360, but already made up half of this move and is currently trading around the level of 1.1421, so the move down was only a spike. If the technical resistance at 1.1421 is clearly violated, then the next target for bulls is seen at the level of 1.1442 and 1.1456. The momentum remains positive, but it is not pointing vertically to the north yet. 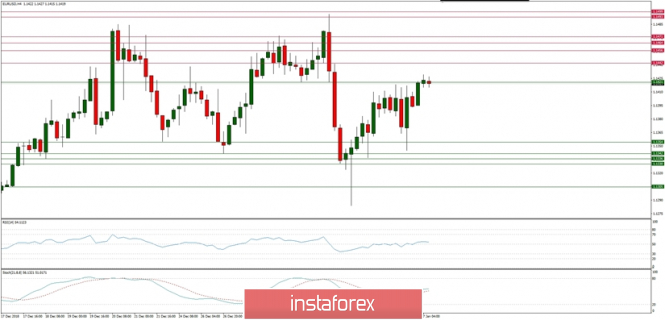 Read more: https://www.instaforex.eu/forex_analysis/131957 |
| Re: News And Technical Analysis From Instaforex by Instaforexbuk(f): 9:16am On Jan 08, 2019 |
Technical analysis for Gold for January 8, 2019 Gold price is pulling back downwards towards $1,280. As we explained in our last analysis, there are a lot of chances that the entire pull back is not over and we could soon see another leg lower towards $1,270. 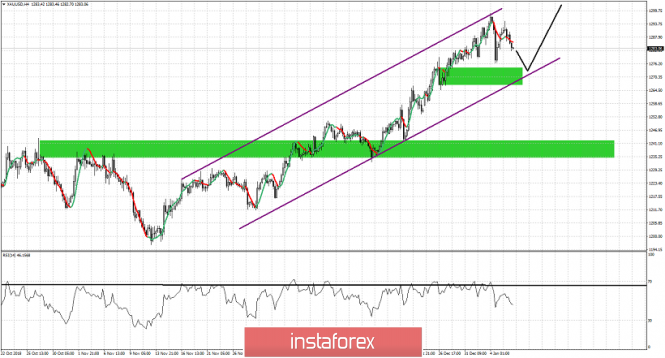 Green rectangles - support areas Black lines - expected path Purple lines - bullish channel Gold price tried to break its recent highs but price got rejected and is pulling back down again. Support is at Friday's low at $1,276.50. If this level is broken, I expect Gold price to move towards $1,270 at least. Price remains inside the bullish channel making higher highs and higher lows. There is no sign of a trend reversal yet or the end of the uptrend. Read more: https://www.instaforex.eu/forex_analysis/132084 |
| Re: News And Technical Analysis From Instaforex by Instaforexbuk(f): 6:59am On Jan 09, 2019 |
Technical analysis: Intraday level for USD/JPY, JAN 09, 2018 In Asia, Japan will release the Average Cash Earnings y/y and the US will publish some economic data such as 10-y Bond Auction, and Crude Oil Inventories. So there is a probability that the USD/JPY pair will move with a low to a medium volatility during this day. 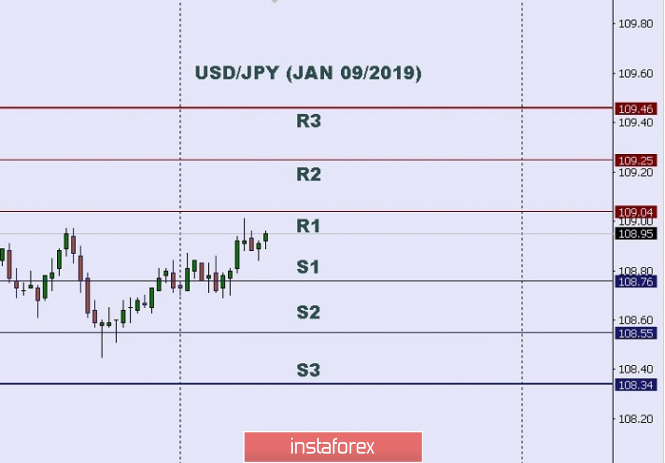 TODAY'S TECHNICAL LEVEL: Resistance. 3: 109.46. Resistance. 2: 109.25. Resistance. 1: 109.04. Support. 1: 108.75. Support. 2: 108.55. Support. 3: 108.34. (Disclaimer) *The market analysis posted here is meant to increase your awareness, but not to give instructions to make a trade. |
(1) (2) (3) ... (14) (15) (16) (17) (18) (19) (20) ... (23) (Reply)
ICPC Arrests Osun FCMB Manager Over New Naira Notes Policy Violation / Kwik Cash Borrowing / Forbes 2015 Billionaires List Released. 5 Nigerians Made The List
(Go Up)
| Sections: politics (1) business autos (1) jobs (1) career education (1) romance computers phones travel sports fashion health religion celebs tv-movies music-radio literature webmasters programming techmarket Links: (1) (2) (3) (4) (5) (6) (7) (8) (9) (10) Nairaland - Copyright © 2005 - 2024 Oluwaseun Osewa. All rights reserved. See How To Advertise. 135 |