News And Technical Analysis From Instaforex - Business (18) - Nairaland
Nairaland Forum / Nairaland / General / Business / News And Technical Analysis From Instaforex (46333 Views)
Get Startup Bonus Of $500 To Trade From Instaforex / News And Technical Analysis From Superforex / News From Instaforex (2) (3) (4)
(1) (2) (3) ... (15) (16) (17) (18) (19) (20) (21) ... (23) (Reply) (Go Down)
| Re: News And Technical Analysis From Instaforex by Instaforexbuk(f): 9:06am On Jan 10, 2019 |
Technical analysis for Gold for January 10, 2019 Gold price is challenging its recent highs. Price did not move as low as $1,270 as we initially expected maybe because the corrective pattern followed was a triangle. Trend remains bullish as long as price is inside the bullish channel. 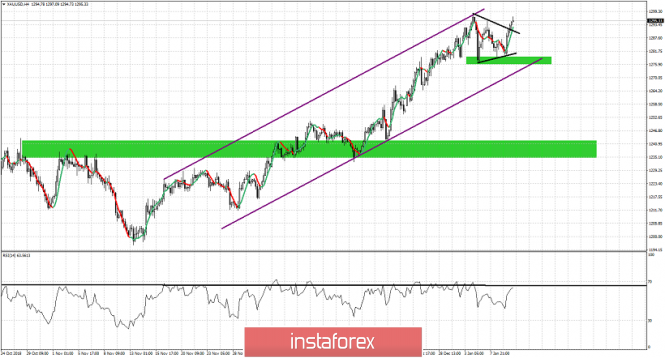 Green rectangles - support areas Purple lines - bullish channel Black lines - triangle pattern The medium-term trend in Gold remains bullish as long as we trade above the $1,240 area. Short-term target is a move above $1,300 maybe towards $1,320. Longer-term target is at $1,350 where we find a long-term resistance. Short-term support is at $1,275 and if broken we could see a move towards $1,265 at least if not lower. So far we have no warning signs from the RSI but we are very close to seeing the first bearish divergence. Bulls remain in control of the trend. Read more: https://www.instaforex.eu/forex_analysis/132346 |
| Re: News And Technical Analysis From Instaforex by Instaforexbuk(f): 7:35am On Jan 11, 2019 |
Forecast for AUD/USD on January 11, 2019 AUD/USD Despite the persistent growth of the "ausie", its stubbornness seems to be false - Australian investors, no less than European, are waiting for a decision on the May project of the English parliament and are ready with equal enthusiasm to storm technical support "when it starts". In the meantime, the Australian dollar adds 30 points amid a stall in commodity growth. On the daily chart, the price has fixed above the Krusenstern line. Provided the growth is not very fast, the price can reach the resistance of the upper border of the price channel without resistance from above the red indicator line of balance. The initial sign of decline will be price fixing under the Krusenstern line for daily and local extremes on November 13 and October 17, followed by a decline to the Krusenstern line on the four-hour chart (0.7078). Fixing under this level opens up the prospect of an already powerful decline to the embedded line of the price channel in the area of 0.6780.
|
| Re: News And Technical Analysis From Instaforex by IFXGertrudePR: 5:50am On May 20, 2019 |
Control zones NZDUSD 05/20/19 The downward movement is a medium-term impulse, so selling is still a priority. It is not profitable to sell on Monday from current grades, since the target of the fall is the weekly CZ of 0.6470-0.6456. Any growth should be used as an opportunity to sell the pair. The first resistance will be WCZ 1/4 06545-0.6542. The downward trend is so strong that it will be possible to look for opportunities for buying only if a daily absorption takes place and the US session closes above Friday's maximum. This model will be the starting point in the formation of a deep correctional model, the next goal of which will be WCZ 1/2 0.6584-0.6577. While the pair will be trading below the specified zone, the bearish trend will not turn. Daily CZ - daily control zone. The area formed by important data from the futures market, which change several times a year. Weekly CZ - weekly control zone. The zone formed by important marks of the futures market, which change several times a year. Monthly CZ - monthly control zone. The zone, which is a reflection of the average volatility over the past year. Analysis are provided by InstaForex |
| Re: News And Technical Analysis From Instaforex by IFXGertrudePR: 7:24am On May 21, 2019 |
Technical analysis of EUR/USD for 21.05.2019 Technical Market Overview: After making the local low at the level of 1.1150, the EUR/USD pair has tried to bounce or even rally higher, but this attempt was capped at the technical resistance zone located between the levels of 1.1167 - 1.1173 and the price reversed. The short-term outlook remains bearish and there is no signs or any trend reversal for now. The next target for bears is seen at the level of 1.1111. Weekly Pivot Points: WR3 - 1.1317 WR2- 1.1287 WR1 - 1.1208 Weekly Pivot - 1.1178 WS1 - 1.1099 WS2 - 1.1069 WS3 - 1.0986 Trading Recommendations: The best trading strategy in the current market conditions is to sell the local pull-backs with a tight protective stop loss. Due to the oversold market conditions please pay attention to the candlestick trend reversal patterns and market trend reversal patterns. The next important technical support is located at the level of 1.1111 and this is the next target for bears. Analysis are provided by InstaForex |
| Re: News And Technical Analysis From Instaforex by IFXYvonne: 8:47am On May 22, 2019 |
Technical analysis of EUR/USD for 22.05.2019 Technical Market Overview: The EUR/USD market is still hovering around the technical resistance zone located between the levels of 1.1167 - 1.1174 with no intention of breaking higher so far. There were some attempts to rally but were quickly capped by the bears. The short-term outlook remains bearish and there is no signs or any trend reversal for now. The next target for bears is seen at the level of 1.1135 and 1.1111. Weekly Pivot Points: WR3 - 1.1317 WR2- 1.1287 WR1 - 1.1208 Weekly Pivot - 1.1178 WS1 - 1.1099 WS2 - 1.1069 WS3 - 1.0986 Trading Recommendations: The best trading strategy in the current market conditions is to sell the local pull-backs with a tight protective stop loss. Due to the oversold market conditions please pay attention to the candlestick trend reversal patterns and market trend reversal patterns. The next important technical support is located at the level of 1.1111 and this is the next target for bears. 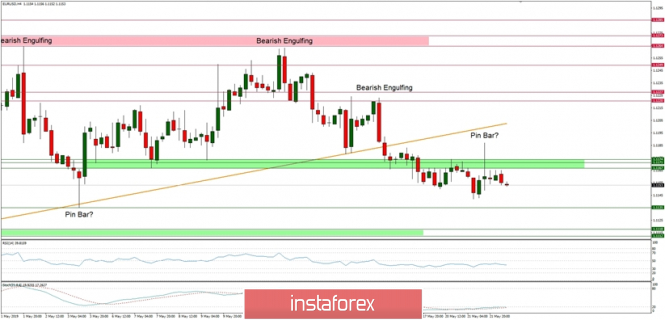 *The market analysis posted here is meant to increase your awareness, but not to give instructions to make a trade. |
| Re: News And Technical Analysis From Instaforex by IFXGertrudePR: 5:50am On May 23, 2019 |
EUR/GBP approaching resistance, potential drop! Price is approaching our first resistance level. Entry : 0.8858 Why it's good : 61.8% Fibonacci retracement, channel's resistance Stop Loss : 0.8956 Why it's good : horizontal overlap resistance, 78.6% Fibonacci retracement Take Profit : 0.8773 Why it's good :23.6% Fibonacci retracement, horizontal overlap support Analysis are provided by InstaForex |
| Re: News And Technical Analysis From Instaforex by IFXGertrudePR: 6:45am On May 27, 2019 |
EUR/USD approaching resistance, potential drop! Price is approaching our first resistance level. Entry : 1.1227 Why it's good : 76.4% Fibonacci retracement, descending resistance line, 61.8% Fibonacci extension Stop Loss : 1.1266 Why it's good : horizontal swing high resistance Take Profit : 1.1180 Why it's good : 38.2% Fibonacci retracement, horizontal overlap support Analysis are provided by InstaForex |
| Re: News And Technical Analysis From Instaforex by IFXGertrudePR: 7:20am On May 28, 2019 |
Technical analysis of ETH/USD for 28.05.2019 Crypto Industry News: One of the largest peer-to-peer cryptocurrencies, LocalBitcoins.com, has banned users living in Iran, according to information published on the company's website. The source previously informed the financial media in an e-mail that the impulse to limit Iranian transactions was to comply with financial regulations in Finland, where the headquarters of LocalBitcoins.com is located. In addition, the stock exchanges allegedly cut off users from Iran because of sanctions previously imposed on other exchanges by the United States. Coinbase and Binance cryptocurrency exchanges do not currently support users residing in Iran as well. Technical Market Overview: The ETH/USD pair might have completed wave (4) and now the market is unfolding the wave (5) to the upside, but the momentum behind the move up is still low. The target for this wave is seen at the level of $304. For now, the market is consolidating the recent gains in a narrow range between the levels of $278.14 - $263.42 as the market participants wait for the breakout. Weekly Pivot Points: WR3 - $321.20 WR2 - $292.77 WR1 - $283.99 Weekly Pivot - $254.33 WS1 - $241.65 WS2 - $213.82 WS3 - $203.55 Trading Recommendations: The best trading strategy in the current market conditions is to buy the local pull-back as wave 4 is in progress in anticipation of the wave 5 to the upside. Please pay attention to the technical resistance at the level of $278.14 as any breakout above this level is bullish. On the other hand, any violation of the level of $226.17 will accelerate the sell-off towards the next technical support at the level of $212.12. Analysis are provided by InstaForex |
| Re: News And Technical Analysis From Instaforex by IFXGertrudePR: 6:50am On May 29, 2019 |
EUR/GBP approaching resistance, potential drop! EURGBP approaching resistance, potential drop! Description : Price is approaching our first resistance level. Entry : 0.8852 Why it's good : Horizontal swing high resistance, 61.8% Fibonacci retracement Stop Loss : 0.8907 Why it's good : 100% Fibonacci extension Take Profit : 0.8773 Why it's good : 23.6% Fibonacci retracement, horizontal overlap support Analysis are provided by InstaForex |
| Re: News And Technical Analysis From Instaforex by IFXGertrudePR: 7:13am On May 30, 2019 |
USD/CHF approaching resistance, potential drop! Price is approaching our first resistance level. Entry : 1.0096 Why it's good : Horizontal swing high resistance, 38.2% Fibonacci retracement Stop Loss : 1.0125 Why it's good : Horizontal swing high resistance, 50% Fibonacci retracement Take Profit : 0.9973 Why it's good : 76.4% Fibonacci retracement, horizontal overlap support Analysis are provided by InstaForex |
| Re: News And Technical Analysis From Instaforex by IFXGertrudePR: 6:31am On May 31, 2019 |
GBP/JPY approaching support, big potential bounce coming!! Price is approaching our first support level. Entry : 137.65 Why it's good : Horizontal swing low support, 61.8% Fibonacci retracement, 61.8% Fibonacci extension Stop Loss : 136.29 Why it's good : 100% Fibonacci extension Take Profit : 139.61 Why it's good : 50% Fibonacci retracement, horizontal overlap resistance, 100% Fibonacci extension Analysis are provided by InstaForex |
| Re: News And Technical Analysis From Instaforex by johnrayz: 11:44pm On Jun 02, 2019 |
Earn at least 10Dogecoin per day for free without any investment http:///MuchCryptoBot?start=639408812 |
| Re: News And Technical Analysis From Instaforex by IFXGertrudePR: 5:52am On Jun 03, 2019 |
Another failed attempt of the Dollar index capture the 98 price level. The Dollar index ended last week on a mixed to bearish note as price recaptured the critical resistance at the 98 price level only to lose it with a big decline on the last trading day of the week. Red rectangle - major resistance Green rectangle - major support The Dollar index made new highs on May 23rd but price reversed and did not close above 98. On May 29th and 30th we saw new higher highs but on a closing basis above the major resistance area depicted with a red rectangle. However on the last trading day we saw another reversal. The inability to break above 98 and stay above it, is a worrying sign for bulls. However as long as price is trading above the green rectangle, bulls remain in control of the trend. The many failed attempts point to a bigger reversal in trend, taking into consideration how much time has the index around 98 which is the 61.8% Fibonacci retracement of the entire decline from 103.75 to 88. Analysis are provided by InstaForex |
| Re: News And Technical Analysis From Instaforex by IFXGertrudePR: 6:33am On Jun 04, 2019 |
Technical analysis of Bitcoin for 04.06.2019 Crypto Industry News: The Japan House of Representatives officially approved a new bill to amend national laws regulating the cryptographic industry. The draft law - prepared by the Japanese Financial Services Agency (FSA) and approved by the House in mid-March this year - was adopted by a majority of votes at the plenary session of the Chamber of Councilors, in accordance with the current update of the FSA on the official website. The project is aimed at introducing changes to two national laws regarding cryptographic assets - the act on the settlement of funds and the law on financial instruments and exchange. Now that the bill has been adopted, the amended acts are expected to enter into force in April 2020. The proposed changes to Japanese financial instruments and payment services will ostentatiously tighten the regulation of cryptocurrencies to promote user protection, more stringent regulation of trading in cryptographic instruments, mitigate industry risks, such as stock market busts, and the broad establishment of a more transparent legal framework for new asset classes. According to earlier reports, the bill also introduces a legal change in the name of cryptocurrencies as "cryptographic assets", previously marked in the country as "virtual currencies". The draft also provides for stricter rules regarding trading in margins, limiting the leverage to double and four times the initial deposit. Technical Market Overview: The BTC/USD pair has made another wave to the downside as anticipated. This wave is a part of the wave 4 correction and so far reached the level of $7,739 after all the technical supports were violated. The next target for bulls is seen at the level of $7,484. This corrective cycle might evolve into an ABCDE Triangle pattern as well, so please keep an eye on the further developments. Weekly Pivot Points: WR3 - $10,284 WR2 - $9,622 WR1 - $9,121 Weekly Pivot - $8.545 WS1 - $8,037 WS2 - $7,438 WS3 - $6,960 Trading Recommendations: The best strategy in the current market conditions is to trade in the direction of the main trend, which is still up. All the local bounces and correction should be treated as another opportunity to open the buy orders for a better price. Please notice, the larger time frame trend is up and there are no signs of any trend reversal. Analysis are provided by InstaForex |
| Re: News And Technical Analysis From Instaforex by IFXGertrudePR: 3:21am On Jun 07, 2019 |
[B]EURUSD: ECB revised the interest rate forecast. Mario Draghi is pleased with the growth of the economy in the 1st quarter, but fears for its future The euro ignored data on the growth of the eurozone economy in the 1st quarter of this year, as traders closely followed the ECB report. Even despite the fact that the expected dates for raising interest rates in the eurozone were shifted to the middle of next year, and Mario Draghi signaled a possible decrease in interest rates to a negative level if necessary, the euro held its position and even rose against the US dollar. According to the report, a good increase in consumer spending in the euro area in the 1st quarter of this year contributed to accelerating economic growth. Export has also made a significant contribution. According to the EU statistics agency, the eurozone economy grew by 0.4% in the 1st quarter of this year compared to the 4th quarter. Compared with the 1st quarter of 2018, the economy grew by 1.2%. In annual terms, an increase of 1.6%. However, it is already known from the results of the latest reports that in the 2nd quarter of this year, GDP growth slows down, and, as many experts expect, growth will be the weakest since the beginning of economic recovery in 2014. As I noted above, the attention of traders was focused on the ECB meeting, at which the regulator left the refinancing rate unchanged, at the level of 0.0%. The European Central Bank left the deposit rate unchanged at -0.40%. The central bank revised its forecast, saying that rates would remain at current levels, at least until the end of the first half of 2020. The ECB will continue to completely reinvest the income from the QE program over a long period after the first rate increase. A new TLTRO program was also announced, according to which targeted long-term loans for banks will be offered at a rate of 10 bp above the average refinancing rate. The euro rose during the speech of the ECB President Mario Draghi, although the statements made by in principal were negative. Draghi noted that he is closely following how monetary policy affects banks, and is ready to act. If necessary, the ECB will adjust monetary policy instruments. As for the extension of the forecast period of saving rates, it was quite expected due to the long-term uncertainty, which is now observed in the global economy. First of all, uncertainty is associated with conflicts in international trade and changes in the policies of central banks. Draghi also said that the ECB may lower interest rates if necessary. As for the economy, the head of the ECB is confident that, despite the stronger growth in eurozone GDP in the 1st quarter of this year, the difficulties in the world still put pressure on the prospects for further growth, and the data indicate a slightly weaker growth in the economy 2nd and 3rd blocks. ECB economists forecast GDP growth in 2019 by 1.2% against the previous forecast of growth of 1.1%, while in 2020 it is expected to grow by 1.4% against the previous forecast of growth by 1.6%. The ECB president is confident that the increase in employment and wage growth will continue to support the eurozone economy, but the threat of protectionism and geopolitical factors will slow it down. Analysis are provided by InstaForex |
| Re: News And Technical Analysis From Instaforex by IFXGertrudePR: 6:34am On Jun 11, 2019 |
USD/JPY to test resistance, a drop is possible! USDJPY to test key resistance, a drop to 1st support is possible Entry: 109.012 Why it's good : 61.8% Fibonacci extension, 23.6% Fibonacci retracement, horizontal pullback resistance Stop Loss : 109.914 Why it's good :50% Fibonacci retracement,horizontal swing high resistance Take Profit : 107.854 Why it's good: 61.8% Fibonacci retracement, 100% Fibonacci extension, horizontal swing low support Analysis are provided by InstaForex |
| Re: News And Technical Analysis From Instaforex by IFXGertrudePR: 7:08am On Jun 13, 2019 |
GBP/USD near support, a bounce is possible! GBPUSD is near support, a bounce to 1st resistance is possible Entry: 1.2844 Why it's good : 100% Fibonacci extension, 38.2% & 23.6% Fibonacci retracement, horizontal swing low support Stop Loss : 1.1256 Why it's good :38.2% & 61.8% Fibonacci retracement,100% Fibonacci extension, horizontal swing low support Take Profit : 1.1342 Why it's good: 100% Fibonacci extension, horizontal swing high resistance Analysis are provided by InstaForex |
| Re: News And Technical Analysis From Instaforex by IFXGertrudePR: 7:30am On Jun 14, 2019 |
Technical analysis of GBP/USD for 14/06/2019: Technical Market Overview: After two Pin Bar like candlestick formation around the upper consolidation boundary, the GBP/USD pair keeps trading close to the support zone located between the levels of 1.2652 - 1.2668. The momentum is barely holding the neutral fifty level and it looks like is about to go lower as well. The stochastic is in the middle of the range now, so all sum up there is no direct signal regarding the future price move now, but the support zone is tempting to be violated. In this scenario, the next target for bears is seen at level 1.2605. Weekly Pivot Points: WR3 - 1.2954 WR2 - 1.2856 WR1 - 1.2800 Weekly Pivot Point: 1.2708 WS1 - 1.2658 WS2 - 1.2549 WS3 - 1.1502 Trading Recommendations: The best strategy in the current market conditions is to trade in the direction of the main trend, which is still down. All the local bounces and correction should be treated as another opportunity to open the sell orders for a better price. Please notice, the larger time frame trend is down and there are no signs of any trend reversal. Analysis are provided by InstaForex |
| Re: News And Technical Analysis From Instaforex by IFXGertrudePR: 5:29am On Jun 17, 2019 |
USD/CAD approaching resistance, potential reversal! Price is approaching its resistance where we expect to see a reversal. Entry : 1.3437 Why it's good : 61.8% Fibonacci retracement, 100% Fibonacci extension, horizontal pullback resistance Stop Loss : 1.3499 Why it's good : 78.6% Fibonacci retracement Take Profit : 1.3364 Why it's good : Horizontal pullback support, 38.2% Fibonacci retracement News are provided by InstaForex |
| Re: News And Technical Analysis From Instaforex by IFXGertrudePR: 6:46am On Jun 18, 2019 |
EUR/GBP near resistance, a drop is possible! EURGBP is near resistance, a drop to 1st support is possible Entry: 0.8982 Why it's good : 100% Fibonacci extension, 78.6% Fibonacci retracement, horizontal swing high resistance Stop Loss : 0.9063 Why it's good :horizontal swing high resistance Take Profit : 0.8791 Why it's good: 61.8% Fibonacci extension, horizontal overlap support, 61.8% Fibonacci retracement Analysis are provided by InstaForex |
| Re: News And Technical Analysis From Instaforex by IFXGertrudePR: 5:58am On Jun 20, 2019 |
USD/JPY approaching support, possible bounce! Price is approaching its support where it could potentially bounce up to its resistance at 108.161 Entry : 107.492 Why it's good : 61.8% Fibonacci extension Take Profit : 108.161 Why it's good : 50% Fibonacci retracement, horizontal pullback resistance, 61.8% Fibonacci extension Analysis are provided by InstaForex |
| Re: News And Technical Analysis From Instaforex by IFXGertrudePR: 6:14am On Jun 24, 2019 |
EUR/USD approaching resistance, potential drop! EURUSD is approaching resistance where we might see a drop in price. Entry: 1.1448 Why it's good : Horizontal swing high resistance, 100% Fibonacci extension, 23.6% Fibonacci retracement Stop Loss : 1.1493 Why it's good : Horizontal swing high resistance Take Profit : 1.1346 Why it's good: 61.8% Fibonacci extension, 23.6% Fibonacci retracement, Horizontal pullback support Analysis are provided by InstaForex |
| Re: News And Technical Analysis From Instaforex by IFXGertrudePR: 7:05am On Jun 25, 2019 |
Forecast for GBP/USD on June 25, 2019 GBP/USD Yesterday, the pound solved the main task for the possibility of further growth - it consolidated above the line of the price channel on the daily chart. The balance line was on top of a strong resistance. The daily Marlin oscillator signal line lies at the horizon, which makes it possible for the pound to continue its slow growth below the balance line and reach the MACD line (1.2832), presumably at the point where both indicator lines coincide. From this point, a reversal or correction is likely. There is a weak convergence on the four-hour chart on the Marlin oscillator, but nevertheless it is closer in form to consolidation in the growth zone, which may soon continue to increase the indicator and price. A signal for a reversal will be the departure of the price below the price channel line on the daily chart and below the MACD line (1.2690) at the four-hour price. Analysis are provided by InstaForex |
| Re: News And Technical Analysis From Instaforex by IFXGertrudePR: 7:08am On Jun 26, 2019 |
EUR/GBP approaching resistance, potential drop! EURGBP is approaching resistance where we might see a drop in price. Entry: 0.8981 Why it's good : Horizontal swing high resistance, 78.6% Fibonacci retracement Stop Loss : 0.9055 Why it's good : Horizontal swing high resistance Analysis are provided by InstaForex |
| Re: News And Technical Analysis From Instaforex by IFXGertrudePR: 2:51am On Jun 27, 2019 |
Technical analysis of Gold for June 27 Gold price has pulled back towards $1,400 as expected and noted in our previous posts. The risk reward ratio did not favor bulls and as the RSI was giving bearish divergence signs, we said that we prefer to take profits and stay neutral when price was above $1,430. Blue lines - bearish divergence Green line - support trend line Gold price has pulled back from $1,439 towards $1,400. The bearish divergence warnings by the RSI have been fulfilled. Price has made the minimum required pull back. Price could continue lower towards $1,380-90 area before resuming its up trend. Short-term support is found at $1,410 and resistance at $1.425. Medium-term trend remains bullish. Gold bears will need to break below $1,270-$1,300 area in order to cancel the importance of this bullish breakout. Analysis are provided by InstaForex |
| Re: News And Technical Analysis From Instaforex by IFXGertrudePR: 6:23am On Jun 28, 2019 |
Forecast for EUR/USD on June 28, 2019 EUR/USD The third day began, as the euro hardly moves from its place in anticipation of decisions from the fields of the G20 and the EU summit. As a result, the indicator lines on the H4 chart are approaching the current price, the oscillator lines on the daily and H4 continue to decline. Now, to create a signal in the medium-term sale, the price is enough to gain a foothold under the MACD line on the four-hour chart (1.1340), which is very close to the lows of the last days. The goal of reducing 1.1234 – the area of coincidence of the nested line of the price channel and the MACD line on the daily scale chart. But, despite the strengthening of the declining version of the order to 65%, the possibility of growth of 35% is high enough to be realized in the movement to 1.1514 – the Fibonacci level of 50% on the daily chart (coincides with the top of January 2019). The growth can consist of two stages: the movement to the Fibonacci level of 61.8% at the price of 1.1445 and the movement to 1.1514. It remains to wait for developments. Again, on the G20, preliminary events are still developing in favor of the dollar. Analysis are provided by InstaForex |
| Re: News And Technical Analysis From Instaforex by IFXGertrudePR: 6:56am On Jul 02, 2019 |
EURUSD: Unemployment will only provide temporary support for the euro, while other indicators will continue to disappoint The euro rose after a report that the number of applications for unemployment benefits in Germany fell, and the unemployment rate in the eurozone fell. This indicates a good state of the labor market, which has recently caused concern to the European Central Bank. However, ahead of the report on the labor market, there were indices for manufacturing in France, Italy, Germany and the eurozone, which leave much to be desired, confirming the negative impact of the protectionist policies of the United States and the slowdown in the global economy against trade conflicts. As I noted above, according to published official data, the number of applications for unemployment benefits in Germany in June of this year fell by 1,000, after rising by 60,000 in May. The employment agency noted that the weak economic situation continues to be reflected in the labor market. Taking into account the seasonal adjustment, unemployment in June remained at the level of 5.0%, whereas in April of this year it reached a record minimum of 4.9%. The number of registered vacancies in June was 798,000, which is also less than in May. The sharp rise in the euro occurred after it became known that the unemployment rate in the eurozone in May of this year fell, not coinciding with the forecasts of economists. However, looking ahead, it is necessary to say that speculative traders in vain ignored the report on the eurozone production index for June, the decline of which will force enterprises to reduce staff, adversely affecting the June report on the labor market. According to the data, in May of this year, the number of unemployed in the eurozone decreased by 103,000 people, while the unemployment rate itself fell to 7.5% (the level of the crisis of 2008) from 7.6% in April. The report noted that the largest reduction in the number of unemployed was registered in Spain and Italy. Why is low unemployment so important for the ECB? In addition to influencing the growth rate of the economy, low unemployment also stimulates the acceleration of inflation, which the regulator is counting on. Data on lending to companies in the eurozone were ignored by traders. According to the ECB report, in May of this year, compared with April, lending to non-financial companies increased by 3.9%, which corresponds to the April rate. Lending to households in the euro area in May increased by 3.3%, as well as in April. Eurozone M3 monetary aggregate grew by 4.8%, while economists had expected the indicator to grow by 4.6% in May. As I noted above, ignoring weak reports on production activity will not lead to anything good. According to the data, the PMI Purchasing Managers Index for the Italian manufacturing sector fell to 48.4 points in June, while Italy's manufacturing PMI was 49.7 points in May. In France, the same index rose slightly in June, reaching 51.9 points, against 50.6 points in May. In Germany, the situation with production activity remains at a very bad level. There, the index remained below 50 points, which indicates a reduction, and amounted to 45.0 points in June against 44.3 points in May. In the euro area as a whole, the PMI purchasing managers index for the manufacturing sector in June dropped even more - to 47.6 points versus 47.7 points in May. As for the technical picture of the EURUSD pair, it remained unchanged. The upward momentum after a good report on the eurozone labor market helped to carry out a number of stop-orders of speculative players, but the market remains on the sellers side. The purpose of the bears is the support test of 1.1310, below which the lows open as early as June 21 - 1.1285 and June 20 - 1.1225. In case of a breakout level of 1.1350, the upward correction will be limited to a high of 1.1370. Analysis are provided by InstaForex |
| Re: News And Technical Analysis From Instaforex by IFXGertrudePR: 7:21am On Jul 03, 2019 |
Technical analysis of GBP/USD for 03/07/2019: Technical Overview: The GBP/USD pair has broken below the 61% Fibonacci retracement located at the level of 1.2611 and is heading lower. The next technical support is seen at the level of 1.2559 and 1.2529. The key support is seen at the level of 1.2505 and if this level is violated the downtrend will accelerate. On the other hand, the nearest technical resistance is seen at the level of 1.2605. Weekly Pivot Points: WR3 - 1.2870 WR2 - 1.2829 WR1 - 1.2757 Weekly Pivot - 1.2708 WS1 - 1.2629 WS2 - 1.2585 WS1 - 1.2508 Trading Recommendations: The best strategy for the current market conditions is to buy the corrections in anticipation of the uptrend to resume. This strategy is valid as long as the level of 1.2505 is clearly violated. The larget time frame trend is still down and the recent rally up is the first sign the trend might be reversing. The key long-term technical resistance is seen at the level of 1.2775 and only if this level is violated, there is a chance for the trend reversal. Analysis are provided by InstaForex |
| Re: News And Technical Analysis From Instaforex by IFXGertrudePR: 5:53am On Jul 04, 2019 |
AUD/USD: commodity market growth and the "hangover" of dollar bulls The Australian dollar continues to gain momentum: the AUD/USD pair confidently overcame the key mark of 0.7000 and consolidated in the middle of the 70th figure. For two days, the pair shows a nearly recoilless growth, returning lost positions. It is noteworthy that the aussie turned 180 degrees after the July meeting of the RBA, at which the regulator lowered the interest rate and allowed a further easing of monetary policy. Such an abnormal market reaction is primarily associated with the general weakening of the US currency. In addition, the aussie continues to receive support from domestic data and the commodity market - in particular, the cost of iron ore continues to stay above $100 per ton. And yet the main driving force behind the growth of AUD/USD is a weak greenback. After the unjustified euphoria, which was associated with the outcome of the G20 summit, a regular "hangover" gradually ensues, aggravated by loud statements by top White House officials. The essence of their comments comes down to the fact that, firstly, relief from Washington is more of a formal nature - for example, Chinese technology giant Huawei remains on the United States' blacklist, despite certain concessions processors). Secondly, the very fact of the truce is under a big question mark - after all, a non-aggression pact was concluded rather than an armistice agreement in Osaka. Today, the White House announced a meeting between US Trade Representative Robert Lighthizer and Chinese Deputy Prime Minister Liu He, which will clear the future prospects for the negotiation process. Washington did not say exactly when this meeting will take place, but noted that it will occur "in the near future." In general, the initial optimism of traders was replaced by concern and uncertainty that another attempt to find a compromise will be crowned with success. Similar doubts from investors have background pressure on the US dollar. To one degree or another, this also affects the US currency's postions in dollar pairs. Weak macroeconomic reports in the US only exacerbate the position of the greenback. The slowdown is demonstrated by both key and secondary economic indicators. Take, for example, the latest releases: an indicator of consumer confidence in the US, an indicator of growth in orders for durable goods, a report on the labor market from ADP, regional indicators of production activity — all of these indicators came out in the red zone, not reaching weak forecast levels. Almost every day, US statistics disappoint investors to some extent, and today is no exception. Thus, activity in the service sector slowed to 55.1 points - this is the weakest result since July 2017. The extremely low influx of new orders (this component of the indicator updated a 2.5-year low) caused a decline in employment in this area, having a mediated effect on the overall slowdown in the US labor market. Experts have previously warned that the service sector will begin to slow down after the manufacturing sector, and now, apparently, these predictions are beginning to materialize. By the way, the indicator of production orders published today came out at the lowest values since the summer of 2016. The indicator is actively decreasing for the second consecutive month, and the May indicator was revised downward (-1.2% instead of the previous -0.8%). This fundamental picture does not allow the dollar to develop to feel comfortable, even with continued demand. And together with the Australian dollar, the greenback is losing its position at the expense of the aussie's "independent" growth. The Australian dollar won back a decline in the interest rate by 0.25% and after the announcement of the expected decision, it began to recover throughout the market. Although Philip Lowe did not rule out further easing of monetary policy, the market focused on current events, pulling up the aussie. First, the strategically important raw material for Australia - iron ore - continues to grow. To date, the cost of a ton of this raw material is already $124 (for comparison, in April this figure was in the level of $80). Secondly, due to the growth in the value of exports of iron ore, Australia recorded a growth in the trade surplus by 16.2% to $4 billion in May compared with April. Judging by the price dynamics of iron ore, the June figures will exceed the May results. High demand for this type of raw materials from Chinese steel mills only confirms this assumption. Thus, despite the RBA's dovish position, AUD/USD buyers use the market's current situation to their advantage. Uncertain positions of the US currency against the background of a substantial growth in the commodity market makes it possible for the aussie to open new price horizons. The first resistance level is the mark 0.7060 - this is the upper line of the Bollinger Bands indicator on the daily chart. When it is overcome, the Ichimoku trend indicator will form a bullish "Parade of lines" signal, which will open the way for AUD/USD bulls to the next resistance level of 0.7180 (the top line of the Bollinger Bands indicator is already on the weekly chart). Support is the aussie's key for a 0.7000 mark. Analysis are provided by InstaForex |
| Re: News And Technical Analysis From Instaforex by IFXGertrudePR: 5:49am On Jul 05, 2019 |
EUR/USD. Calm before the storm: the market hid in anticipation of the Nonfarm report Today, the windless weather on the foreign exchange market: the European session was not rich in macroeconomic reports, and the US trading platforms are completely closed: Independence Day is celebrated in the United States. The nearly empty economic calendar allows you to take a wait-and-see position, especially on the eve of Friday's releases, which will certainly provoke strong volatility. It is noteworthy that on the eve of a "stormy Friday" the market ignored a rather alarming signal, which was voiced by US President Donald Trump. He again accused China and Europe of using currency manipulations, also complaining that Washington only obediently observes this process. The Chinese Foreign Ministry has already responded to this statement by Trump, publishing a concise refutation of the voiced accusations. Brussels ignored the words of the American president, although the reaction of Europe would hardly be different from the Chinese. On the one hand, the situation has exhausted itself - Donald Trump often voices his thoughts or complaints with the help of Twitter. On the other hand, the concern of the US president about this issue is alarming for some currency strategists (in particular, Bank of America), given Trump's ability to take unconventional steps in his policy. Therefore, after the head of the White House once again accused Europe and China of manipulating currency, experts began saying that the president could initiate the use of currency intervention in the coming months. Analysts estimate the likelihood of this scenario in different ways. But almost all of the economists surveyed by Bloomberg do not exclude such a scenario. Especially - if the Fed in July does not reduce the interest rate, and the ECB, in turn, will prepare the ground for the introduction of additional incentives in the autumn. As some currency strategists believe, the White House needs a substantial dollar drawdown across the entire market - by 10-20%. In the context of the euro-dollar pair, this means that the price should rise to levels five years ago, to the area of 1.31-1.37, up to level 40. Naturally, this will cause a domino effect - eurozone inflation is not the only thing that will suffer, but the entire EU economy as a whole, after which the ECB will resort to appropriate mitigation measures. But, as they say, "in war - as war": by launching a flywheel of currency manipulations, the White House will understand perfectly well that central banks of other countries will take a defensive position, devaluing their currencies. As you know, there are several types of interventions, among them sterilized and unsterilized. In the first version of the intervention, the New York Fed will acquire or sell securities on the open market, but will not interfere with monetary policy. Unsterilized intervention directly affects the money supply and rates. And if during sterilized currency intervention the value of the monetary base is maintained, in the second case, the intervention leads to a change in the monetary base. What kind of tool the White House will apply is an open question, and it has become increasingly discussed in the foreign exchange market. According to many analysts, Trump's rhetoric in this regard will only become tougher in the near future. But the traders actually ignored the important, in my opinion, signal from the US president. The market is focused on the upcoming events, namely the Nonfarm, which will be published tomorrow. According to preliminary forecasts, the growth rate of people employed in the non-agricultural sector will grow to "acceptable" values, that is, to 164 thousand. This is much less than the levels at which the indicator went out during the past year and the first quarter of the current year: the indicator practically did not fall below the 200 thousandth mark, and often exceeded the 300 thousandth level. But compared to May, when the number of employed has grown by only 74 thousand, this result will look quite good - but only if the real figures coincide with the predicted ones. Let me remind you that, according to the latest ADP report, the number of people employed in June increased by only 102 thousand. This report is the main guideline on the eve of the publication of official data. Given the relatively weak result from ADP, the June Nonfarm may also disappoint traders. In this case, the dollar is unlikely to be able to hold its position and weaken throughout the market. You should also pay attention to the indicator of the average hourly wage, which is an inflationary indicator. On a monthly basis, over the past three months, it has been at the same level - 0.2%. And on an annualized basis, the index in May is minimal, but unexpectedly dropped from 3.2% to 3.1%. In June, wages should demonstrate a positive trend - both in monthly and annual terms. If this forecast is not justified, the US currency will fall under additional pressure. In general, tomorrow's release either eliminates concerns about the aggressive easing of the monetary policy of the Fed, or, conversely, returns concern about this. In the second case, the EUR/USD pair will get another chance to gain a foothold in the 13th figure, breaking the resistance levels of 1.1305 (the Bollinger Bands average line on the daily chart) and 1.1340 (the Tenkan-sen line on the same timeframe). Otherwise, the bears will finally seize the initiative on the pair, up to the achievement in the medium term, up to the lower limit of the Kumo cloud on D1, that is, to the level of 1.1185. Analysis are provided by InstaForex |
| Re: News And Technical Analysis From Instaforex by IFXGertrudePR: 6:36am On Jul 08, 2019 |
EUR/USD. 5th of July. Results of the day. NonFarm Payrolls - the killer of European currencies 4-hour timeframe The amplitude of the last 5 days (high-low): 42p - 90p - 47p - 44p - 22p. Average amplitude for the last 5 days: 49p (51p). The last trading day of the current week has passed with the US currency having full advantage. There was only one reason for this - the publication of the NonFarm Payrolls report for June. Analysts' forecasts predicted 162,000 new jobs outside the agricultural sector, but in reality there were 224,000. Such a strong excess of the real value over the forecast naturally provoked strong purchases of the US dollar and so the US currency rose by 60 points against the euro. Against the background of strong NonFarms, traders ignored unemployment in the United States, which rose to 3.7%, as well as weaker wage growth than originally estimated. However, the key question for the entire currency market now is: do strong NonFarm mean the end of a period of failed macroeconomic statistics in the US or is it just an accident? As we all see, the US dollar has almost completely offset all losses against the European currency, which suffered during the month when reports from the United States could not please even the most ardent optimists. Only 120 points are left to reach the year lows and such a resurrection of the US dollar occurred, by and large, without particularly strong support from the foundation. Now a new question arises: if the macroeconomic statistics ceases to disappoint, the Fed may not soften the monetary policy in 2019, respectively, the main advantage of the euro, which bulls of the euro/dollar pair could plummet into oblivion. What should the euro count on in this case? There is no answer to this question yet, but we state the fact: the US dollar is very close to "returning to the game" and in the near future it will be possible to state the resumption of a downward trend. Trading recommendations: The EUR/USD pair resumed its downward movement. Thus, it is now again recommended to sell the euro with the target of 1.1177. At the beginning of the new trading week, new levels of support and resistance will be formed. It is recommended that you buy the euro/dollar pair not earlier than when prices have consolidated above the Kijun-sen line. However, this will require a strong fundamental basis for the bulls. In addition to the technical picture should also take into account the fundamental data and the time of their release. Explanation of the illustration: Ichimoku indicator: Tenkan-sen - the red line. Kijun-sen - the blue line. Senkou Span A - light brown dotted line. Senkou Span B - light purple dotted line. Chikou Span - green line. Bollinger Bands indicator: 3 yellow lines. MACD Indicator: Red line and histogram with white bars in the indicator window. Analysis are provided by InstaForex |
| Re: News And Technical Analysis From Instaforex by IFXGertrudePR: 7:08am On Jul 09, 2019 |
Technical analysis of GBP/USD for 09/07/2019: Technical Market Overview: The GBP/USD pair has broken through the technical support at the levels of 1.2559, 1.2529 and 1.2505 on its way down to the new swing low made at the level of 1.2476. As we can see the price is now out of the descending channel, which is a very bearish sign. There is a Pin Bar made at the new swing low at the level of 1.2476, but so far there is not much bullish pressure on the market and the bears are still in full control of the market. The nearest technical resistance is located at the level of 1.2559 and it might be tested soon due to the oversold market conditions. Weekly Pivot Points: WR3 - 1.2853 WR2 - 1.2772 WR1 - 1.2630 Weekly Pivot - 1.2551 WS1 - 1.2402 WS2 - 1.2319 WS3 - 1.2180 Trading Recommendations: The best strategy for the current market conditions is to follow the larger timeframe trend. The larger time frame trend is still down and there are no signs of any trend reversal. The key long-term technical support is seen at the level of 1.2431 and the key long-term technical resistance is seen at the level of 1.2775 and only if this level is violated, there is a chance for the trend reversal. Analysis are provided by InstaForex |
(1) (2) (3) ... (15) (16) (17) (18) (19) (20) (21) ... (23) (Reply)
Femi Otedola And His Wife With Bill Gates / Photo: See The Lagos Taxi Driver That Uses POS / Chinese Man Speaking Complete Igbo To His Nigerian Customer In China(pics)
(Go Up)
| Sections: politics (1) business autos (1) jobs (1) career education (1) romance computers phones travel sports fashion health religion celebs tv-movies music-radio literature webmasters programming techmarket Links: (1) (2) (3) (4) (5) (6) (7) (8) (9) (10) Nairaland - Copyright © 2005 - 2024 Oluwaseun Osewa. All rights reserved. See How To Advertise. 145 |