 Politics › Re: Lagos Now Officially An Oil Producing State- Ambode by scholes0(m): 10:08pm On May 16, 2016 Politics › Re: Lagos Now Officially An Oil Producing State- Ambode by scholes0(m): 10:08pm On May 16, 2016 |
Harvesthomes:
Any good Geology/Geography/Chemist would know oil in Badagry in commercial quantity iis a joke.You'll only get 2 spoons daily..Look at the Map you will understand why oil is where oil is...but all the best Lagos and does your silly map also explain why there are oilfields offshore ghana? lmao.... 2 kobo geologists everywhere forming expertise. |
| Politics › Re: Lagos Now Officially An Oil Producing State- Ambode by scholes0(m): 8:44pm On May 16, 2016 |
TonyeBarcanista:
Congratulations to the people of Lagos and Yorubas in general Very mature man you are! |
| Politics › Re: 2016 United Nations Human Development Report For Nigeria. (UNDP HDR) by scholes0(op): 8:02pm On May 16, 2016 |
onenaira2:
[s]Dummy I argued with multiple of your ppl on NL who kept trying to claim their are yolobas in Anioma ( an area I'm from and know u a are not one of us). Hell during GEJ conference, the itsekiri community leaders had to come out and complain severally because your south west leaders pushed them into the southwest/yoloba delegates. I was also on NL when you lots kept arguing with Edo about being one of y'all ( I can back every thing I just stated with links..you need it cause I'll be more than happy oblige). The reason they mention that South West keep trying to divide SS and SE is because una are. In my beginning years on Nl, I lost how many of una I and several people I had to fight who kept trying to put a wedge between Anioma and SE (y'all still do that shit even till this day). I was on this NL when you lots tried to steal Oyigbo, Egbema, etc who proudly accept their Igbo origin and attach it to ijaw. Infact, their was even an thread from an id Ogoni militant who was supporting a SS and SE unification and you lots descended on it shouting "SE wants your oil". It's harbour watching minority SS mop una to the floor on that thread. Likewise, when the Akwa Ibom guy, NDPVF and uduak I believe dragged una, you lots tried to turn every SS against Akwa Ibom. Let's not forget the NDA bombing, I lost how many of you people opened a thread wailing on how "SE and Igbos are the enemies of SS". Etc. So pathetic.. no wonder nobody in both regions like una excluding maybe itsekiri and urhobo/Isokos.
Anyway
In just 2014, you lagged behind in everything you lead in 2013..in just ONE YEAR you fell that backwards and you shamefully try to tell us to listen to a 2013 report over a more recent data. How pathetic...na so your sophisticated be?
I feel bad for una..Always the I get am before mentality while everybody else jeep jumping una in everything. The only thing you got left is poverty rate, which based on the data you just posted, the gap is so small, I can bet everything I got you'll lag in that too soon. grin grin grin heyya ndoooooooo kpele
Now cry me a huge river like you doing now
That gap is small or did you think I forgot the report? The only reason SE had a highest number was because of Ebonyi. Infact, the rest of their states was neck in neck author the rest of SW states. Considering that Ebonyi is currently in a growth basis, likewise their Anambra while the rest of your states, especially Osun, is on a downfall as we speak...I bet you, that poverty rate will become another one of una "I get am before"....quote me on that anyday[/s] lamentations of a crying Abasha man... I am done with you sorry. |
| Politics › Re: 2016 United Nations Human Development Report For Nigeria. (UNDP HDR) by scholes0(op): 8:00pm On May 16, 2016 |
Yorubanews:
That's how we know it's fraud. Lol Even you sef sabi use common sense to decode am lol, exactly. When a report says a state like Borno is having higher pass rates than any state in the West. then even a third stage psychiatric patient will know, something fishy is smelling..... ol  |
| Politics › Re: 2016 United Nations Human Development Report For Nigeria. (UNDP HDR) by scholes0(op): 7:56pm On May 16, 2016 |
Yorubanews:
While the SW can stand along in regionalism, SE needs SS land/oil nau. They have no access to the sea nor do they have oil (3%) na chicken change.
SW has oil in Lagos, Ondo and Ogun. to be honest, the SE is no match for the SW is ANYTHING.... people, resources, potential... what have you. They know it as well as we know it, and that is why they feel the perpetual need to gumbody with the minority tribes of the South to stand on the same pedestal as Yorubas. loool..... will that work? I highly doubt. |
| Politics › Re: 2016 United Nations Human Development Report For Nigeria. (UNDP HDR) by scholes0(op): 7:52pm On May 16, 2016 |
Yorubanews:
Noise. Where's Nigeria Bureau's methodology? If it's reliable, it would be transparent?
Ibos keep passing around fraudulent data for people to swallow.
I say no. UN's data is the most recent research conducted in Nigeria as far as Nigerians are concerned. looo..... you dey mind these people? Isn't it funny that an Igbo person is choosing to accept data source from a government they CLAIM hates them and is marginalizing them over one from a Globally reputable body? not to mention that the difference in the sources of data used is less than half a year...... looool |
| Politics › Re: 2016 United Nations Human Development Report For Nigeria. (UNDP HDR) by scholes0(op): 7:48pm On May 16, 2016 |
Yorubanews:
Can you find the NBS methodology online? Can their research be replicated? Nope.
That's why UN, a widely respected organization, is more valid than local Nigerian researchers.
When well respected research is conducted, why do SW always beat SE? they keep thinking we are their mates in everything.....lol they aren't even in our shadow, talk less being on the same level. |
| Politics › Re: 2016 United Nations Human Development Report For Nigeria. (UNDP HDR) by scholes0(op): 7:45pm On May 16, 2016 |
onenaira2:
See more painment. I don't need to attach to a region I'm from unlike southwaaste that tries desperately to force themselves into south south.
Anyway, As I said, cry me more Rivers 
Here is the report again
https://www.nairaland.com/2263635/south-east-south-west-south-south-lead-attainment
In just 2014, you lagged behind in everything you lead in 2013..in just ONE YEAR you fell that backwards and you shamefully try to tell us to listen to a 2013 report over a more recent data. How pathetic...na so your sophisticated be?
I feel bad for una..Always the I get am before mentality while everybody else jeep jumping una in everything. The only thing you got left is poverty rate, which based on the data you just posted, the gap is so small, I can bet everything I got you'll lag in that too soon. heyya ndoooooooo kpele
Now cry me a huge river like you doing now loool slop.... SW forcing itself on SS? That is new... no be us dey shout SW and SS, SW divided by SS. we are one our own, and we know. Are you from your own admissions accepting the fact the the SW is the richest geopolitical zone in Nigeria by saying "the gap is small" .... lol, SW is the second most populated zone in Nigeria, so that gap you think is "small" (over 7%) is nothing less than 10 million people. continue sobbing into your by now drenched pillow.... guy from Abasha. www.nairaland.com/attachments/2578269_a_jpeg14a53cac5a312f3d1ad4980fec051d42Ntooooor! |
| Politics › Re: 2016 United Nations Human Development Report For Nigeria. (UNDP HDR) by scholes0(op): 7:41pm On May 16, 2016 |
Ariani:
"The MPI has been estimated by OPHI and published in UNDP human development reports since 2010".
That's what I got from your link.
UNDP conducted no such studies, Oxford university did and published it in UNDP reports.
Btw, Oxford Data are still flawed, as I suspect they gathered them from local authorities and not from
the streets. keep saying that to yourself, their data sources are all from UN agencies, and that is the only reason why UN would publish it. Because it was a work in tandem. http://hdr.undp.org/en/statistics/understanding/sources |
| Politics › Re: 2016 United Nations Human Development Report For Nigeria. (UNDP HDR) by scholes0(op): 7:37pm On May 16, 2016 |
Yorubanews:
And the want for SS oil and lands to replicate Lagos in the SE. It's the SS natives I pity the most for allowing these land grabbers to call themselves SSners. lol.... does it surprise you we always hear them and their signature SS and SE, SS/SE, SS cum SE, SS divided by SE + SS * SE..... lol.... weakest Zone in the south for real. |
| Politics › Re: 2016 United Nations Human Development Report For Nigeria. (UNDP HDR) by scholes0(op): 7:32pm On May 16, 2016 |
|
| Politics › Re: 2016 United Nations Human Development Report For Nigeria. (UNDP HDR) by scholes0(op): 7:29pm On May 16, 2016 |
onenaira2:
Dumbass I'm from Asaba Delta state you monkey. Everybody knows or did you buffon ass think every igbo is from SE. Secondly, you went there to contradict the safest report ( you just stated that) and chest beat ( evidence page 0-page 1) unfortunately for you, a 2014 report alreadycontradicts your own quick to chest beat data. Now you all are crying abd trying to discredit a more RECENT collected data. As I said if it took SE a year to over shadow you people in almost everythinf you lead highest in in 2013. it shouldn't even take that long to overshadow una in everything else. It is even extremely pathetic in just a year, the lead you tried to chest beating on, was overshadow. Pathetic and pitiful seriously who cares if you are from Asaba or Abasha? The report on Multidimensional poverty is Even more recent than the one you are quoting from 2014..... and is still shows the SW leading the country..... I know it must be hurting your ass real bad, but hey, it is what it is... Abasha guy. |
| Politics › Re: 2016 United Nations Human Development Report For Nigeria. (UNDP HDR) by scholes0(op): 7:26pm On May 16, 2016 |
Yorubanews:
And poverty rate. Exactly. More SW women have jobs compared to SE women, but this UN report is telling all of us that Gender parity is higher in the SE.... but hey, I am not arguing. but one bedbug is coming here to tell me than a report released in Oct 2014 carried out by NBS has more credibility than the UN data on poverty released in 2015. |
| Politics › Re: 2016 United Nations Human Development Report For Nigeria. (UNDP HDR) by scholes0(op): 7:17pm On May 16, 2016 |
onenaira2:
Oh so that's why you posted this. To show how SW lead highest than SE in 2013. Heya...it must have pained to learn they overshadowed una in just a year and all you can hold onto is the poverty rate. Heyaaaaaaa. If it took just ONE YEAR for them to overshadow una in everything else, I will not be surprised if they overshadow una in that poverty rate you are holding so dearly in a very short period of time lol..... see this fool, I follow the UN's facebook page, and this is their latest report on Nigeria. I naturally went there and published the reports. later did I see that a punch journalist had even quoted this report to say the SE was the safest Nigerian zone....lol How can you be better off than the SW, when your zone has the second highest infant mortality in the entire country... consistently? shame shame... |
| Politics › Re: 2016 United Nations Human Development Report For Nigeria. (UNDP HDR) by scholes0(op): 7:07pm On May 16, 2016 |
onenaira2:
And so what? It did And? Oh you think I was arguing against the report. Dummy, read my post all over again so your head can be reset to functional again. Ok smartie, since you aren't arguing against the report, we can all decisively accept what it says, while you can go to bed. What are you stressing yourself for since the SE is decisively poorer than the SW.? |
| Politics › Re: 2016 United Nations Human Development Report For Nigeria. (UNDP HDR) by scholes0(op): 7:03pm On May 16, 2016 |
Ariani:
The multidimensional poverty stat was not conducted by UNDP, it was conducted by Oxford university, who did not conduct any fresh studies themselves, but relied on flawed data from NBS which placed Niger state as the state with least poverty rate.
That topic had Bern debated and exhausted on NL here by many Igbo posters, let me look for the links of those debates and Post for the reading pleasure of the neutrals and newbies here. guy, pls stop deceiving yourself the methodology of measuring multidimensional poverty may have been developed by Oxford which is a top global research university IN COLLABORATION with the UN. But the field survey to collect the data was carried out purely by UN staff in Nigeria.... Oxford does not even have the means nor the funds to go on a field survey in over 100 developing countries of the world. The Global Multidimensional Poverty Index (MPI) was developed in 2010 by the Oxford Poverty & Human Development Initiative (OPHI) and the United Nations Development Programme.[1] and uses different factors to determine poverty beyond income-based lists. It replaced the previous Human Poverty Index. The global MPI is released annually by OPHI and the results published on its website.
The global Multidimensional Poverty Index (MPI) is an international measure of acute poverty covering over 100 developing countries. There is the methodology for you. http://hdr.undp.org/en/content/multidimensional-poverty-index-mpihttp://www.ophi.org.uk/wp-content/uploads/MPI_2011_Methodology_Note_4-11-2011_1500.pdf?cda6c1 |
| Politics › Re: 2016 United Nations Human Development Report For Nigeria. (UNDP HDR) by scholes0(op): 6:57pm On May 16, 2016 |
onenaira2:
Did I say UN report is unreliable? Did I fault the report of UN? Did I disagree with UN report if so, point it out. I said and I quote, the UN reported a 2013 report while the government of the nation already provided a 2014 report showing that south waaste declined in just ONE YEAR.
Your blother was the one who tried to discredit the 2014 data like you are doing right now (case in point your reference agbalumo tree local data and beer palor gist.) and try to credit that UN is more reliable than the government of a nation thus we should drop a year later report (2014) and listen to a year before report (2013) because that favours una over the 2014 report. LAUGHABLE!!!!
All I showed your blother is UN can never be more reliable of a nation's government as they even admitted being unreliable in dataset of some nations. loooool.... The 2015 report on POVERTY still shows that the SE is poorer What do YOU have to say about that then? |
| Politics › Re: 2016 United Nations Human Development Report For Nigeria. (UNDP HDR) by scholes0(op): 6:52pm On May 16, 2016 |
Ariani:
The multidimensional poverty stat was not conducted by UNDP, it was conducted by Oxford university, who did not conduct any fresh studies themselves, but relied on flawed data from NBS which placed Niger state as the state with least poverty rate.
That topic had Bern debated and exhausted on NL here by many Igbo posters, let me look for the links of those debates and Post for the reading pleasure of the neutrals and newbies here. It was conducted by BOTH the oxford university AND the UN. and their dataset was not obtained from the NBS. But wait, how can one igbo man be supporting the Nigeria bureau of statistics because it says something good about SE, and another Igboman here is Opposing the NBS because their report does not look so dandy about the SE? looool.... |
| Politics › Re: 2016 United Nations Human Development Report For Nigeria. (UNDP HDR) by scholes0(op): 6:49pm On May 16, 2016 |
|
| Politics › Re: 2016 United Nations Human Development Report For Nigeria. (UNDP HDR) by scholes0(op): 6:45pm On May 16, 2016 |
onenaira2:
Reporting a 2014 collected data.
The OP report was posted in 2016 reporting a 2013 collected data. Just because something was posted in 2016 or 2015 does not mean it's representing that specific year it was posted. It represent the year they spoke up.
Read the dataset again and look at the year each spoke of.
The UN reported a 2013 stats
The Nigeria bureau reported a 2014 stats.
You shouldn't even be proud of that shit. I don't know about una I'll be ashamed cause it showed in just a year you lost that lead and that's a damn shame ok wait....so you mean to say that between 2013 and 2014 the SE has overtaken the SW in infant mortality, education index, Women in gainful employment, population to public spending ratio, life expectancy, and everything else.... ? Oh pls b realistic.....  |
| Politics › Re: 2016 United Nations Human Development Report For Nigeria. (UNDP HDR) by scholes0(op): 6:27pm On May 16, 2016 |
|
| Politics › Re: 2016 United Nations Human Development Report For Nigeria. (UNDP HDR) by scholes0(op): 6:23pm On May 16, 2016 |
Ariani:
The data was captured for 2008-2013.
: https://www.nairaland.com/2263635/south-east-south-west-south-south-lead-attainment
This is a more recent data.
And more reliable. And as usual, SE leads. BUT when one journalist used this same data source to say SE is the safest region in the country, it was sufficient enough then abi? Take it or leave it, this is a 2015 report. the report on multidimensional poverty which ranked the SW as the richest region in Nigeria is a 2015 report. So go and sit down abeg. |
| Politics › Re: 2016 United Nations Human Development Report For Nigeria. (UNDP HDR) by scholes0(op): 6:10pm On May 16, 2016 |
Rayhutar:
Remember that Lagos is not only indigenous to Yorubas, Egun and Ijaws are also, Lagos was former Benin Empire territory, developed with Nigeria money from 1960 to 1991, Abuja is receiving the same development not from oil money, after Gwari people will be telling us how their handwork developed Abuja. cancelled Ijaws are not indigenes of Lagos abeg .... |
| Politics › Re: 2016 United Nations Human Development Report For Nigeria. (UNDP HDR) by scholes0(op): 4:45pm On May 16, 2016 |
...... |
| Properties › Re: NEMA Officials At The Scene Of Ogun Building Collapse Today by scholes0(m): 2:41pm On May 16, 2016 |
hinohsend:
..
How were they able to rescue people if they werent on ground last week? mostly, it is everyday people like you and me who are the first responders on the scene of such events that dig people out. Then emergency comes waaaaaaay later on the line. |
| Properties › Re: NEMA Officials At The Scene Of Ogun Building Collapse Today by scholes0(m): 2:31pm On May 16, 2016 |
lol... spraying water now to a building that has collapsed since last friday?
The funniest part is that they won't be there on ground as at last week when the event actually occurred. |
| Politics › Re: 2016 United Nations Human Development Report For Nigeria. (UNDP HDR) by scholes0(op): 2:25pm On May 16, 2016 |
YonkijiSappo:
State breakdown nor dey ni?
lumping the states into the geopolitical zones, will not let us see the individual strides made by each state towards development.
A very bad or good performer in one region can bring averages down very quickly or boost averages unnecessarily. Abeg, it is better like this. Its high time we start thinking of ur regions as federating units. India with about 7 times our population has only 29 states and 7 Union territories. Indonesia with a bigger population (260 million) and bigger landmass that we do, has only 34 provinces. |
| Politics › Re: 2016 United Nations Human Development Report For Nigeria. (UNDP HDR) by scholes0(op): 2:14pm On May 16, 2016 |
Kudos to the three Southern Zone of Nigeria for their strides towards development, but most especially the South West and the South-South Zones.
May the North also improve in their socio-economic indices for a better Nigeria. |
| Politics › 2016 United Nations Human Development Report For Nigeria. (UNDP HDR) by scholes0(op): 2:11pm On May 16, 2016*. Modified: 2:29pm On May 16, 2016 |
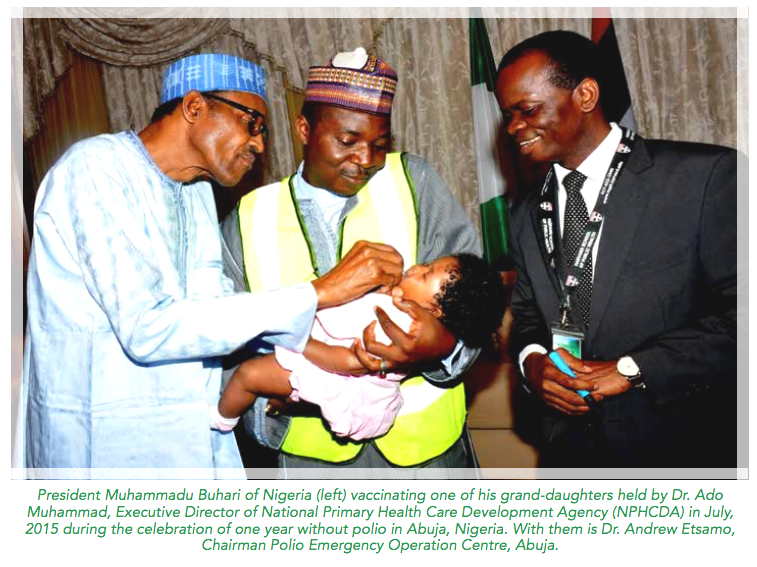
The preparation of this 2015 NHDR has been made possible by the contributions and support of many individuals and organizations who generously gave their valuable time and ideas. First and foremost is the UNDP Country Office in Nigeria for providing both financial and technical support right from inception. The team is particularly grateful for the unwavering guidance and support of the UNDP Nigeria team led by Pa Lamin Beyai (Country Director) and Ojijo Odhiambo (Senior Economic Advisor), Robert Asogwa (National Economist) and Grace Arinze-Ononwu (Economic Research Associate). A special appreciation is also due to Colleen Zamba (immediate former Economic Advisor), who provided valuable input at the onset of the process. The NHDR also benefited greatly from the advice and guidance of the former UNDP Resident Representative, Daouda Toure as well as the former Director-General of NISER, Prof. Olufemi Taiwo. https://c2.staticflickr.com/8/7591/26446259313_8d02a32d81_o.jpgThe following are the main points of the UNDP report on Nigeria. HEALTH* A long and Healthy Life :
Life expectancy remains for the health dimension of HDI. This however encapsulates several variables and is itself determined by various factors, hence its comprehensiveness. Life expectancy at birth is the average number of years a newborn infant would be expected to live if health and living conditions at the time of birth remained the same throughout life. It reflects the health of a people, the quality of care they receive when ill as well as social, economic and environmental conditions which
mitigates or predisposes to morbidity and mortality. Life expectancy has been on the increase since 2009. However, NBS statistics in this respect differs.
Demographic and health factors such as the quality of preventive and curative healthcare facilities and access to these, impact on life expectancy directly; while social conditions equally impact length and quality of life through a less direct path.
The persistence of harmful social conditions such as war, conflict, crime, terrorist attacks and accidents in various forms will ultimately also diminish life expectancy at birth. Reductions in infant and under five mortality rates, increased access to nutritious food, and to primary health care, access to improved water sources and sanitation are all expected to be positively correlated with increased life expectancy at birth. Education is equally a key factor as it moderates behaviour and influences lifestyle habits alongside with preventive care. * Life expectancy index:
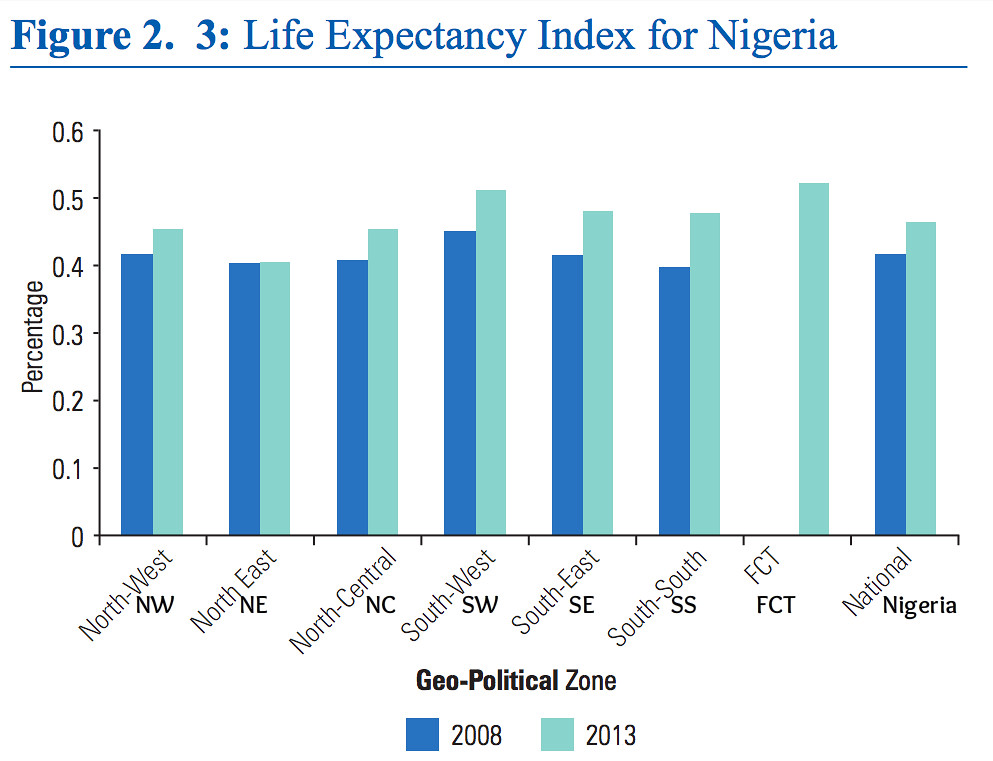
Although the national data shows there are declines in life expectancy at birth between 2012 and 2013, the life expectancy index for Nigeria shows improvement from 0.415 in 2008 to 0.464 in 2013. The increase in life expectancy index over the two years occurred in all geopolitical zones. In both years (2008 & 2013), life expectancy index was highest in the South-West and lowest in the North-East. Incidentally, the North-East geopolitical zone is mostly troubled by security challenges and incidence of terrorist attacks in
Nigeria LIFE EXPECTANCY INDEX FOR NIGERIAhttps://c2.staticflickr.com/8/7434/26396251643_f666f70d1e_b.jpg-------------------------------------------------------- EDUCATION* Knowledge, Learning and Literacy:
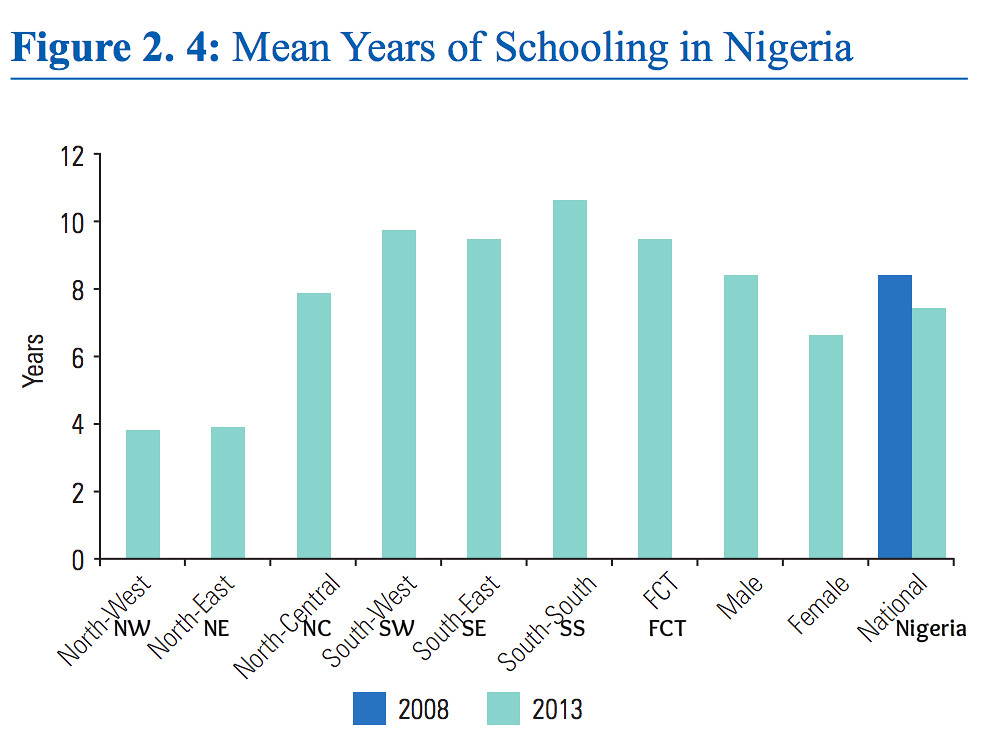
This is measured by the Educational index, which is computed using Mean Years of Schooling (MYS) i.e (The average value of the 6.3.3.4 syatem completed) and Expected Years of Schooling (EYS) reflect the knowledge, learning and literacy of a people. Across the geo-political zones, data for 2013 shows that mean years of schooling was highest in the South-South zone (10.664), and followed by the South West Zone. It is lowest in the North-West zone (3.8126)
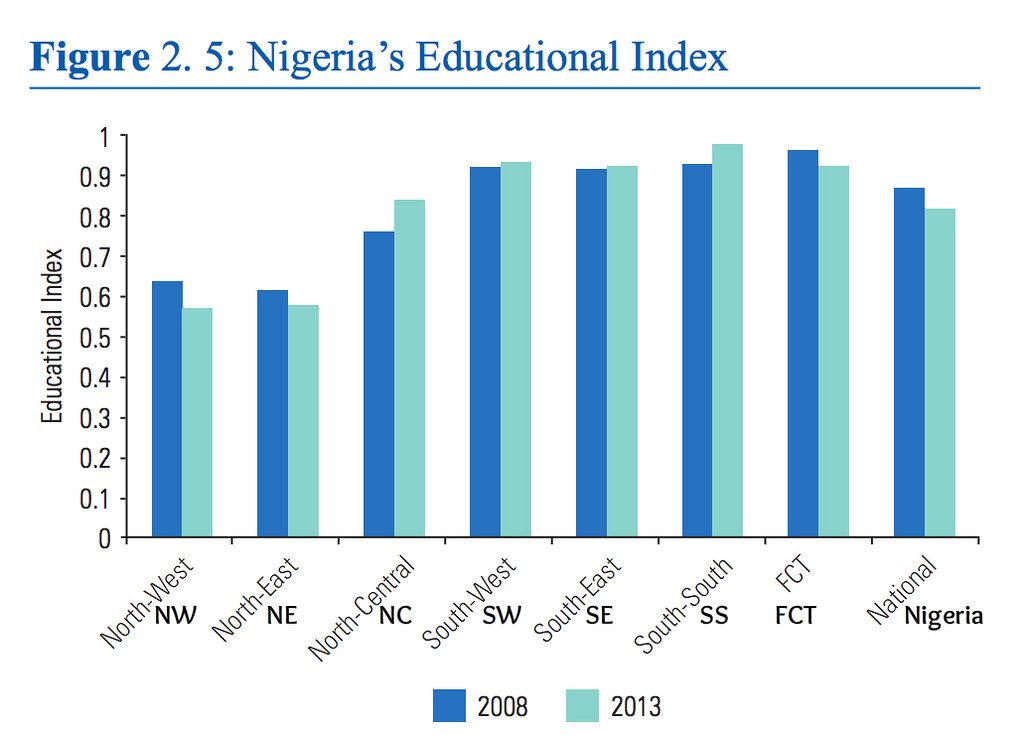
The North-East and North-West zones had values lower than the national average figure, while the southern zones all had higher values than the national average figure. MEAN YEARS OF SCHOOLING IN NIGERIAhttps://c2.staticflickr.com/8/7381/26967190656_ba77b11db1_b.jpgThe educational index across geopolitical zones presented in Figure 2.5 shows there were declines in the North-West, North-East, in the FCT and in the nation as a whole between 2010 and 2013. However, other zones in the south and the North-Central zone experienced increase in the educational index. Educational Index was highest In the South-South zone, followed by the South West and then the South East Zone. It was lowest in the North West Zone Zone, and closely followed by the North East. NIGERIA'S EDUCATIONAL INDEXhttps://c2.staticflickr.com/8/7604/26967288926_81483a0fc8_b.jpg--------------------------------------------------------- WEALTH AND LIVING STANDARD* Income and a Decent Standard of Living:
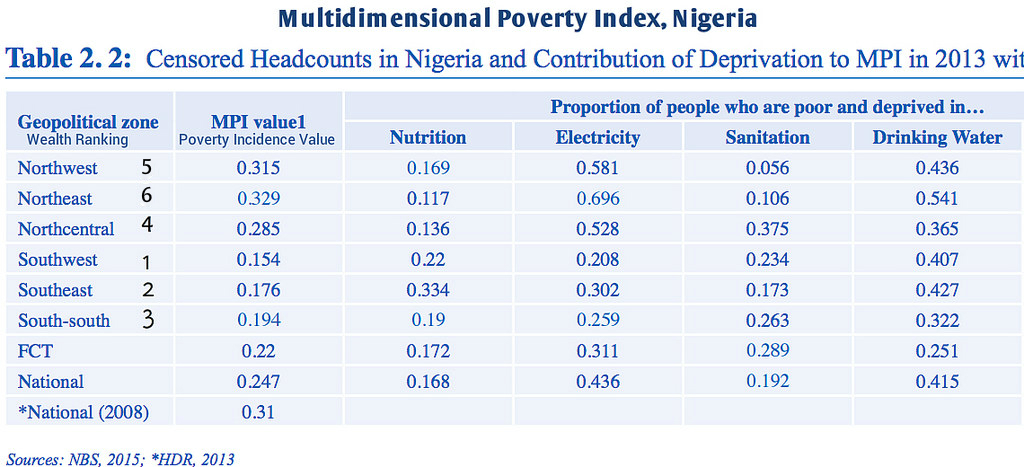
Decency in living standards incorporates factors related to income, health, assets and inequality. The degree to which there is decency in living standard is the degree to which people have overcome poverty.
Poverty measures are therefore useful in explaining decent living standards. The Multi-dimensional Poverty Index (MPI) represents a holistic measure of people’s deprivations in health, education and standard of living using ten indicators across these dimensions. The MPI combines information on the proportion or incidence of people’s deprivations as well as the intensity of
these deprivations. The index can also be decomposed by population sub-groups. The Table shows a breakdown of MPI (Poverty Index) for the geopolitical zones and the FCT, with the South-West recording the least MPI value of (0.154) and the North East recording the highest MPI Value (0.329) in 2013. This indicates that the combined measure of the incidence and the intensity of poverty is lowest in the South-West zone and highest in the North East Zone Since the MPI represents a combined measure of deprivation across dimensions of education, health and living standards, a similar pattern showing better performance in the south as opposed to the northern
geopolitical zones is observed for MPI. The northern geopolitical zones have the highest MPI values. POVERTY INDEX RANKING FOR NIGERIAhttps://c2.staticflickr.com/8/7216/26968364586_fc3fa7c2c3_b.jpg--------------------------------------------------------- GENDER EQUALITY* Gender Equality:
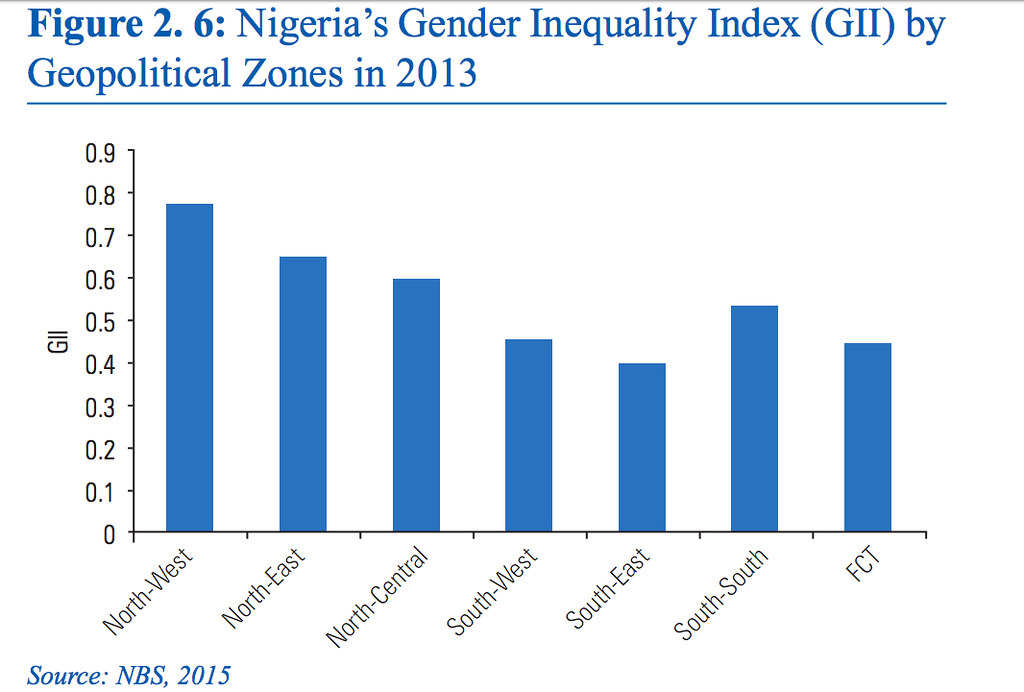
Inequality measures are also useful in assessing decency and living standards.
If growth is occurring in an economy, and such an economy still exhibits high inequality indices, then such growth is said to be non-inclusive. Non inclusive growth contradicts the principle of decent living standards and mitigates desirable development outcomes. The Gender Inequality Index (GII) is a measure of inequality between males and females in the population. It incorporates three dimensions namely: reproductive health,and labour market.
Indicators for these dimensions include maternal mortality rates (MMR), Adolescent Fertility Rates (AFR), share of parliament seats for males and females, and labour force participation rate. The higher the value of GII the wider the inequality gaps between males and females. The GII is highest in the North-West (0.774) and lowest in the South-East (0.397). All the southern
geopolitical zones had GII values lower than the national average (0.579), while the northern zones all had GII values higher than the national average figure. The implications are that the indicators for the GII dimensions (MMR, AFR, share of parliament seats, and labour force participation rates) perform better in the southern states than in the northern states.empowerment GENDER INEQUALITY BY ZONES, NIGERIAhttps://c2.staticflickr.com/8/7338/26907317612_2cca82e66d_b.jpg--------------------------------------------------------- WOMEN IN GAINFUL EMPLOYMENT OUTSIDE AGRICULTURE* Women in gainful employment:
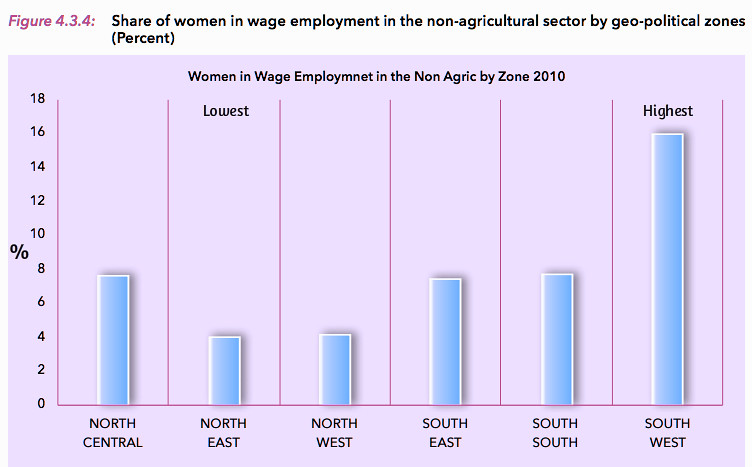
According to the latest nationally available data, In terms of geo-political zones, the share of women in wage employment in the non-agricultural sector in the North-central zone in 2010 was 7.6%; North-east, 4%; and North-west, 4.2%. The shares for the other zones were: South-east, 7.4%; South-south, 7.7%; and South-west, 16%. The latter (South West) was the highest among the zones, while the NE and NW (4% & 4.2%) were the lowest. Also, the available data shows that the share of women wage employment in the urban areas increased from 3.1% in 2009 to 14.8% in 2010. For the rural areas, it was 5.8% in 2009 and 5.6% in 2010. SHARE OF WOMEN IN WAGE EMPLOYMENThttps://c2.staticflickr.com/8/7542/26444317864_64dc3c37cd_b.jpg--------------------------------------------------------- POVERTY INCIDENCE BY TOTAL HEADCOUNT RATIO* Poverty Incidence (Headcount ratio):
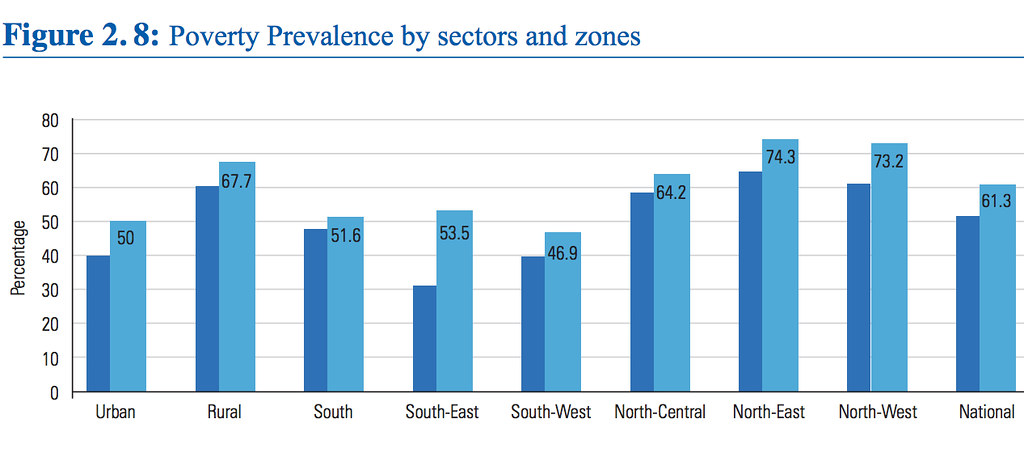
According to the NBS (2013) about 112 million Nigerians live below the poverty line. Poverty incidence,measured by the headcount ratio, worsened in all the
geo-political zones and sectors (rural and urban) of the country in 2010 when compared to 2004. It has remained higher in rural areas and northern zones
than in urban areas and southern zones. It is striking to note that the headcount ratio almost doubled in the South-East zone (a zone which recorded the least incidence in 2004) and increased more in urban areas than in the rural areas of the SE. The trend in total population of the poor is shown in Figure 2.9. It reveals that more Nigerians were poor between 2004 and 2010.
However, recent computation by the World Bank, using GHS panel, indicates that poverty rates are significantly lower than estimates based on 2009/2010
HNLSS. It dropped from 35.2 per cent in 2009/2010 to 33.1 per cent in 2012/2013 (as opposed to 62.2% from the 2009/2010 HNLSS) (World Bank, 2014b). This implied that about 56 million Nigerians were poor compared to about 113 million in previous estimates.
Poverty incidence is seen to be lowest in the South West Zone (46.9%), followed by the South-South (51.6%), Incidence of poverty is highest in the North East (74.3%), closely followed by the North West (73.2%) POVERTY PREVALENCE BY SECTORS AND ZONEShttps://c2.staticflickr.com/8/7778/26396115774_68f80a5cef_b.jpg--------------------------------------------------------- POPULATION TO PUBLIC SPENDING RATIO* Spending on Education, Health and Public Administration:
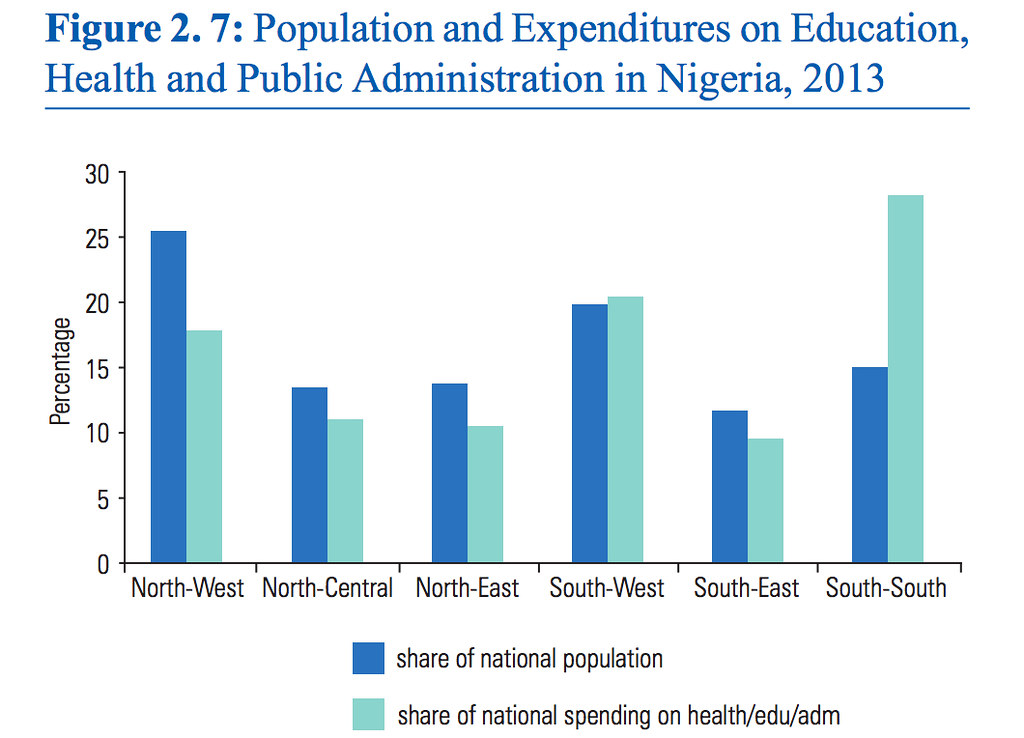
The underlying factors in the unequal distribution of wealth and development outcomes may be further explained by a comparison of the share of population spending on key sectors such as education and health. Spending connotes investment and investments are expected to yield returns. Figure 2.7 shows population shares as well as shares of expenditure on education, health and public administration, and attempts a comparison of these variables across the geo-political zones.
The pattern shows that the northern zones and the South-East record lower shares of spending than shares of national population. Wider disparities
in shares of the two variables are noticeable in the northern zones. South-West recorded a slightly higher spending (20.4%) than its share of population (19.8%), while the South-South zone has by far, a higher share of
spending (28.2%) than its share of population (14.9%)..
The expected returns on investment in education and health are improved knowledge, learning, literacy and better opportunities for advancement; increased life expectancy as well as wider socio economic benefits. NATIONAL POPULATION SHARE AND EXPENDITURES ON EDUCATION, HEALTH & PUBLIC ADMINhttps://c2.staticflickr.com/8/7616/26397511783_38a2e14c82_b.jpg--------------------------------------------------------- INFANT MORTALITY* Child Mortality in Nigeria:
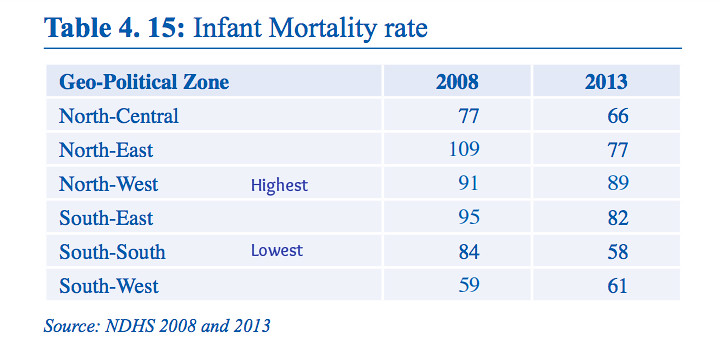
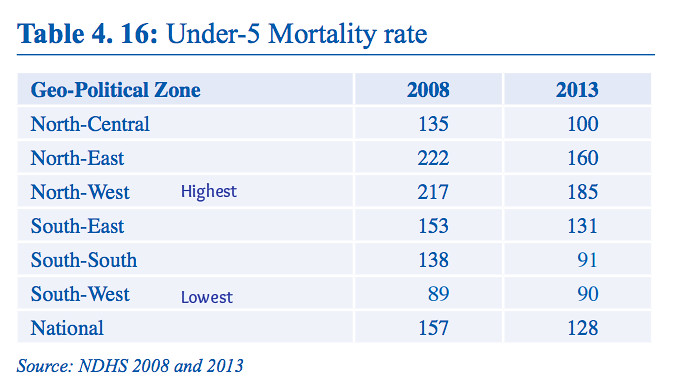
The status of some health indicators has improved since the 1990s. For instance, Under-5 Mortality Rate dropped from 99 in 1990 to 89
in 2014; Infant Mortality rate dropped from 91 in 1990 to 58 in 2014; while maternal Mortality rate dropped from 1000 in 1990 to 243 in 2014. (FRN, 2015) This improved status is expected to have positive impact on the status of human security and human development.
infant mortality declined from 93 between 1999 and 2003 period to 69 between 2009 and 2013 period while correspondingly, under 5 mortality dropped from 185 to 128. As presented in Table 4.15 all the zones experienced reduction in infant mortality between 2008
and 2013. As at 2013, the North-West Geo-political zone recorded the highest infant mortality (89/1,000 live births) rate, followed by the South East (82/1,000 live births) while the lowest rates were recorded by the South-South (58/1,000) zone followed closely by the South West. (61/1,000) INFANT MORTALITY RATES BY ZONES IN NIGERIAhttps://c2.staticflickr.com/8/7080/26980487021_64d5bd827b_b.jpgUnder 5 mortality rate is highest in the North West (185 per 1,000 children), followed by the North East (160/1,000). It is lowest in the South West (90/1,000 children) followed closely by the South South (91/1,000) UNDER 5 MORTALITY RATES BY ZONES IN NIGERIAhttps://c2.staticflickr.com/8/7454/26774559060_c44f372e29_b.jpgSOURCE: http://www.ng.undp.org/Download Page: Research and Publications National Human Development Report, May 12, 2016. http://www.ng.undp.org/content/nigeria/en/home/library/cc: Seun , Mynd44 , Lalasticlala This is very important |
| Travel › Re: Night Scene Of Bodija And Samonda, Ibadan: Beautiful Pictures. by scholes0(m): 1:19am On May 09, 2016 |
EgunMogaji:
Mi o mo iru aisan ti oni sugbon emi ki nsun ni ago marun irole
Ode tun wa kere si iru awon ti ole ma pa ase fun iru emi bayi. Lowa bikan joko si, ki owa awon egebe e si iwaju.
Lo pon si eyin oruko elomi. |
| Travel › Re: Night Scene Of Bodija And Samonda, Ibadan: Beautiful Pictures. by scholes0(m): 1:01am On May 09, 2016 |
EgunMogaji:
Ki lokan e pelu iwa mi lori Nairaland? Aki se ara ile.
Se ti e, ki e mi se te mi. Rora se afoju ran.
Eyi to ba wumi ni mo le se pe lu ile ati ile, ko kan e Shioor.... esi yin ko ya mi l'enu rara. Owo ara won ni won fi n se ara won. Ilu ko da, Ilu ko da, sugbon awon gangan lo n ba ilu je. E lo sun jare. Odigba. |
| Travel › Re: Night Scene Of Bodija And Samonda, Ibadan: Beautiful Pictures. by scholes0(m): 12:47am On May 09, 2016 |
EgunMogaji:
Se ki aye iwo owo ori ti awa mejeji ti san lati odun meta seyin ni ilu ibadan?
Korofo ofifo loma npa ariwo
Iran baba baba mi ti wo ilu ibadan lati ijebu lati odun 1901, mo ni ile ati ile ni ilu ibadan.
Momo wipe oro mi dun ewo inu ora eran, sugbon otito, won sowipe, ogoro.
Gbe iborun e lo si odo elomi. Duro si owo tire, ki emi na duro si owo temi. E lo tun Ile ti e ni si Ilu Ibadan se. Ilè ti e ni, E lo fi se nkan gidi... Eleyi ti e fi n ro ejo wewe lori nairaland yii, Ko tun ti eni kankan se. Iran baba yin lo ko awon ile ti orule won ti di pupa, E lo ko awon Ile tuntun ojulode, ki e ye s'awada kaakiri. |


